The Weekly Takeaway:
- The S&P 500 gained 0.49% this week. It is up 12.65% for the year to date;
- The Nasdaq-100 gained 0.43% this week. It is up 15.59% for the year to date;
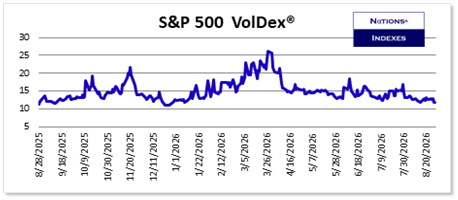
- S&P 500 VolDex fell 7.18% this week to close at 11.69, back down near the bottom of its 52-week range;
- The 10-year Treasury note yield fell 1.8 basis points to close at 4.720%, though it rose 4.8 basis points on Friday alone after Fed Chair Warsh spoke;
- Crude oil futures fell 4.16% to close at 83.44, giving back all of the prior week's 5.66% gain and then some;
- Every S&P 500 volatility measure fell, and PutDex fell hardest, down 9.41% against CallDex's 2.77%, which pulled RiskDex down 10.86% to 2.74 (Learn More About CallDex);
- The front week volatility drained out completely: 7-Day VolDex fell 13.33% to 9.70 and 7-Day PutDex fell 23.45%, while 1-Day VolDex rose 7.54% to 8.09;
- Nasdaq-100 VolDex fell 11.32% to close at 16.99, a steeper decline than the S&P 500's;
- Treasury Note 7-Day VolDex rose 20.57% to 6.30, the only front-end volatility anywhere in our coverage that rose;
- Gold RiskDex rose 14.30% and Silver RiskDex rose 26.25% as the call bid in the precious metals broke (Learn More About RiskDex);
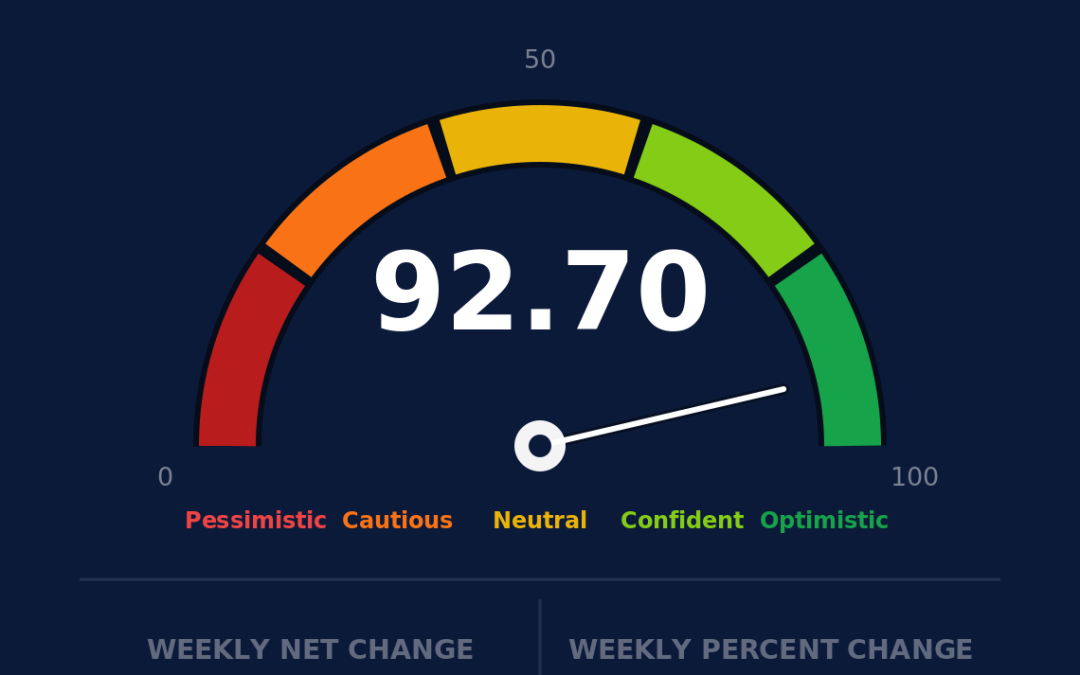
- The Nations Investor Optimism Index® rose 2.61 points to 92.70, and every one of the 19 single-name VolDex readings we cover fell this week;
- You can always learn more about all our indexes at Learn More About Our Indexes.
Equity Index Volatility:
Kevin Warsh used his first Jackson Hole speech as Fed chair to say that inflation is running above target, that the Fed's predominant focus right now should be on prices, and that the central bank has more work to do. Traders heard it and moved their September odds toward a hike. Two-year yields jumped. The S&P 500 gave back part of its gains on Friday and still finished the week higher.
And the option market spent the week selling protection.
S&P 500 VolDex fell 7.18% to close at 11.69, giving back the previous week's increase and then some. That is a reading back down among the cheapest of the past year, and it arrived in the same week the Fed chair said the inflation fight was not over. Thirty-day at-the-money implied volatility on the most-watched index in the world now costs less than it did before Jackson Hole and before Nvidia reported (Learn More About VolDex).
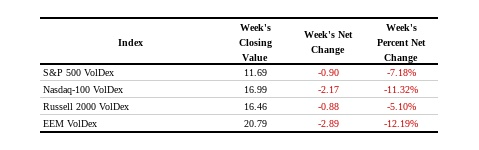
The decline was broad. Nasdaq-100 VolDex fell 11.32% to 16.99. Russell 2000 VolDex fell 5.10% to 16.46. Emerging Market Equity VolDex fell 12.19% to 20.79, the largest drop of the four. The Nasdaq-100 falling harder than the S&P 500 is worth a note: it came in the week Nvidia delivered blowout earnings and the AI complex spent two sessions digesting them. Event risk that has already happened is not risk anymore, and the option market repriced it accordingly.
What matters more than the level is the mechanism. S&P 500 PutDex fell 9.41% to 47.84 while CallDex fell only 2.77% to 16.43. RiskDex, which measures what traders pay for downside relative to upside, fell 10.86% to 2.74. That is close to the low end of where it has traded over the past year.
Why It Matters… A falling RiskDex can mean two very different things. It can mean traders are bidding up calls, which is enthusiasm. Or it can mean they are letting go of puts, which is complacency. This week it was the second one. Put prices came down almost four times as fast as call prices. Nobody got excited; they simply stopped paying for insurance in the week the Fed told them the inflation fight had more room to run.
Option Window®:
The Option Window shows exactly where the money went, and this week it drew one of the cleanest pictures we have seen in months.
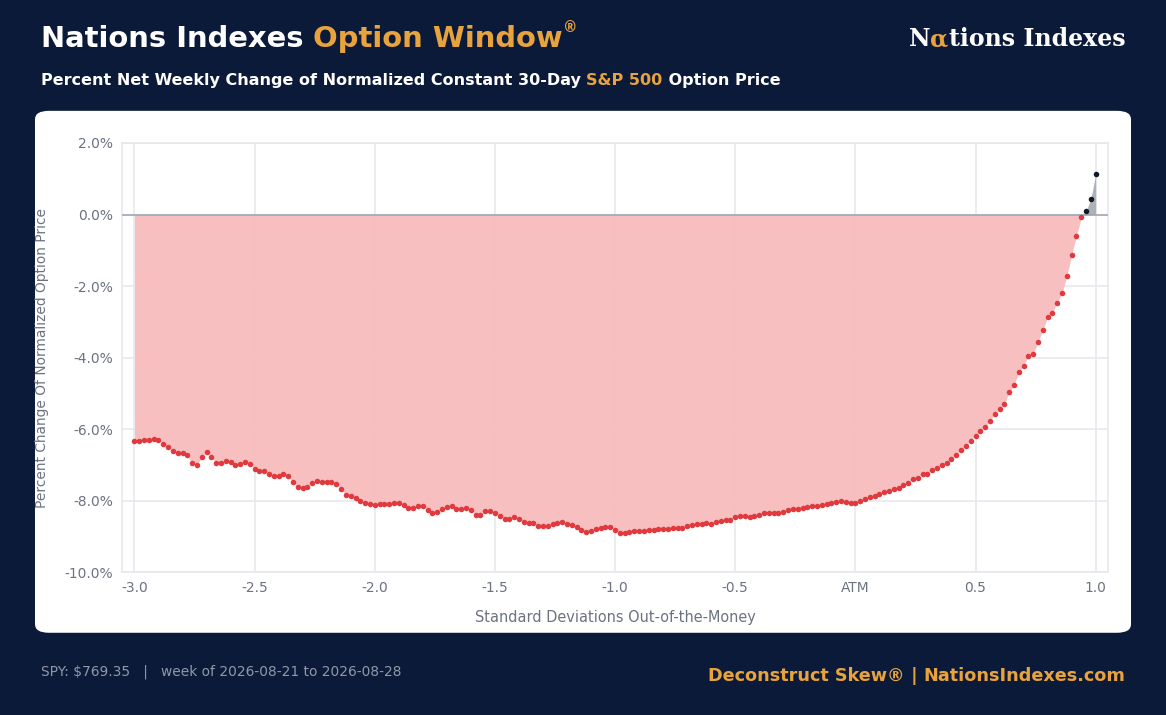
Every strike from three standard deviations below the market up to roughly one standard deviation above it got cheaper on the week. The deepest discount, about 8.9%, sat right around one standard deviation out-of-the-money to the downside, exactly where an investor with equity exposure would buy a hedge. Three standard deviations down, the true crash strikes, still cheapened by more than 6%.
The Option Window already accounts for the underlying's move, so this is not the mechanical effect of SPY drifting up to $769.35. This is traders deciding what they want to own. They sold their downside and they sold their at-the-money.
Nations TermDex® Term Structure:
Last week the front of the S&P 500 curve was bid hard because the market had two dates circled: Jackson Hole and Nvidia earnings. Both have now happened, and the front week collapsed.
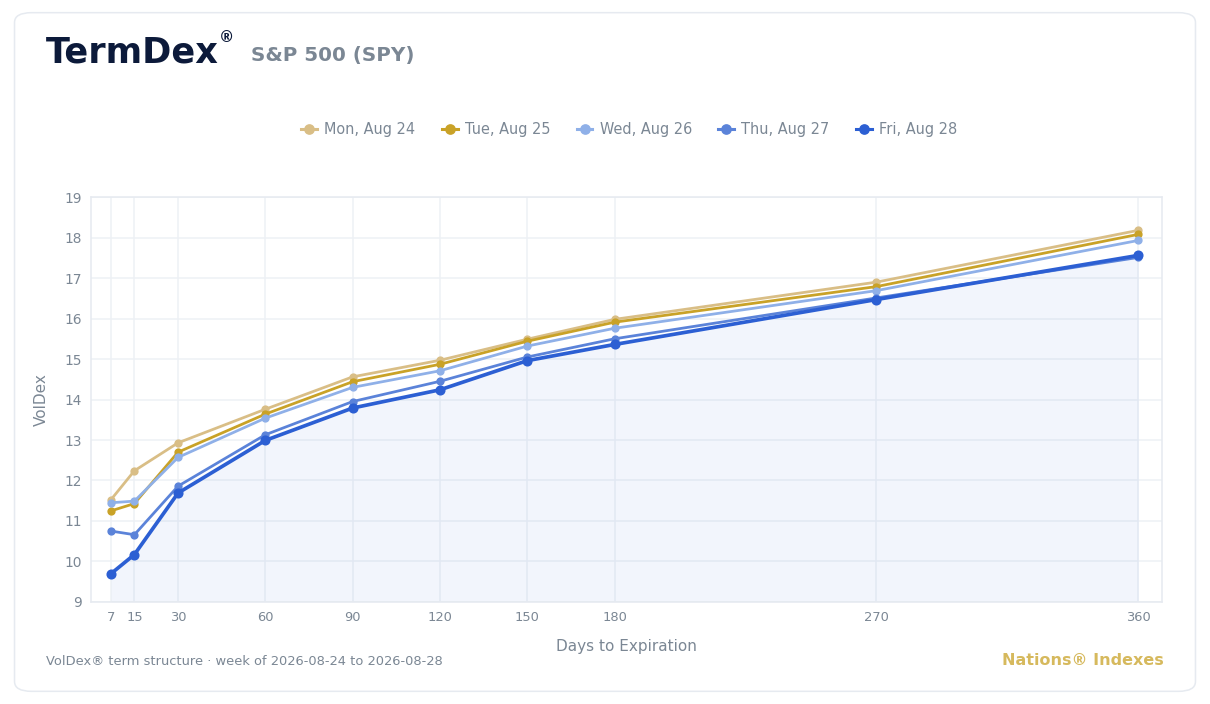
Seven-day VolDex closed Friday at 9.67, down from 11.45 on Monday. Fifteen-day fell to roughly 10.2. The 30-day sits near 11.7 and the curve rises steadily out to about 17.55 at 360 days. The front end lost about 1.8 volatility points across the week while the back end gave up roughly 0.6. The result is one of the steepest, most orderly contango slopes of the year (Learn More About TermDex).
7-Day PutDex told the same story more bluntly, falling 23.45% to 16.32. The premium traders paid for a one-week put ahead of Jackson Hole did not get exercised into a payoff; it simply evaporated. That is what event volatility does when the event is uneventful, and it is why buying front-week protection into a scheduled catalyst is a timing bet as much as a risk decision.
0 DTE and 1DTE Options:
One index went the other way. S&P 500 1-Day VolDex rose 7.54% to close at 8.09, the only S&P measure on our board to finish higher. That is likely due to traders wanting to own very cheap volatility on the chance that something unfortunate will happen in the Persian Gulf this weekend.
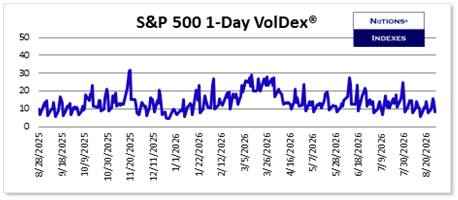
An 8.09 reading is still historically cheap and the increase is small in absolute terms, but it is directionally interesting against a 7-day reading that fell 13% and a 30-day reading that fell 7%. Same-day traders paid a little more for a day's worth of movement even as everyone with a longer horizon marked protection down. Friday was a genuine two-way session, selling off on Warsh and then recovering into the close, and the one-day market appears to have noticed.
Nations Investor Optimism Index®:
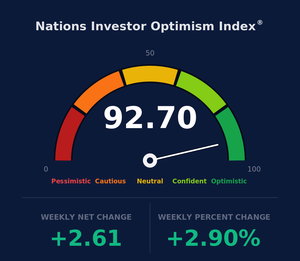
The Optimism Index rose 2.61 points to 92.70, sitting deep in the optimistic band and near the top of its scale. The index is built from S&P 500 VolDex, TailDex and RiskDex measured against their rolling two-year ranges, so a week in which all three fell together mechanically pushes it higher (Learn More About the Optimism Index).
Other Asset Volatility:
Treasury Bonds and Notes:
Treasury Note VolDex fell 4.69% to 5.57, an extraordinarily low number by any standard. Treasury Note PutDex fell 18.75% to 13.84, which is the market letting go of its fear that yields spike. Treasury Bond VolDex fell 3.52% to 10.49.
But look at the front week. Treasury Note 7-Day VolDex rose 20.57% to 6.30. That is the only front-end volatility reading anywhere in our coverage that increased, and it came in a week when everything else at the front of every curve was being sold. Meanwhile Treasury Note 7-Day CallDex fell 40.05% to 3.73, so this was not somebody positioning for a rally.
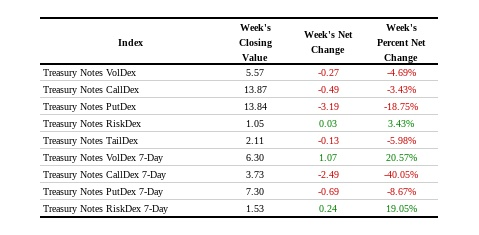
Why It Matters… Equity traders spent the week concluding that Warsh's hawkishness was priced. Bond traders spent it doing the opposite at the only tenor that covers next Friday's payroll report and the run-up to a genuinely live September meeting. Two markets, one Fed, opposite conclusions. When the equity front week is at 9.67 and the note front week is bid, the cheaper hedge for a Fed surprise is not in the S&P 500.
Precious Metals:
Gold fell on the week and the option market's posture flipped with it. Gold VolDex fell 10.31% to 22.95. Gold CallDex fell 11.62% to 69.38. Gold PutDex rose 0.25% to 57.08. Gold RiskDex rose 14.30% to 0.83.
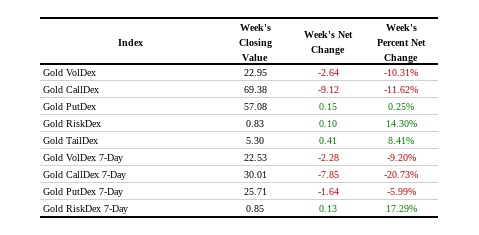
Silver was the same trade, louder. Silver CallDex fell 17.60% to 136.53 while Silver PutDex rose 6.71% to 97.60, and Silver RiskDex jumped 26.25% to 0.70.
Both metals still carry call skew, which is normal for them; a RiskDex below 1.00 means calls cost more than puts. What changed this week is that the gap narrowed sharply, and it narrowed from both directions at once. Traders stopped paying up for the upside and started paying for the downside. That is a real two-sided repricing rather than a drift, and it is the cleanest expression of a hawkish Fed anywhere in our numbers. Higher-for-longer real yields are a direct headwind for metals, and the option market moved before the spot market finished the argument.
Bitcoin:
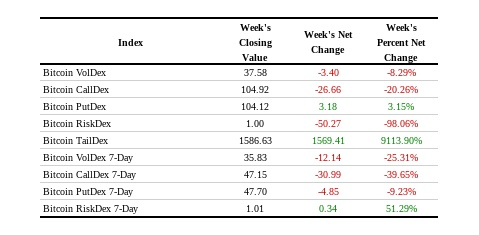
Bitcoin VolDex fell 8.29% to 37.58 and Bitcoin CallDex fell 20.26% to 104.92 while Bitcoin PutDex rose 3.15% to 104.12. The same shape as the metals: the upside bid left, the downside bid stayed. Bitcoin RiskDex now sits right at 1.00, meaning calls and puts are priced almost identically, and for an asset that usually carries a call premium, symmetry is itself a statement.
Equities:
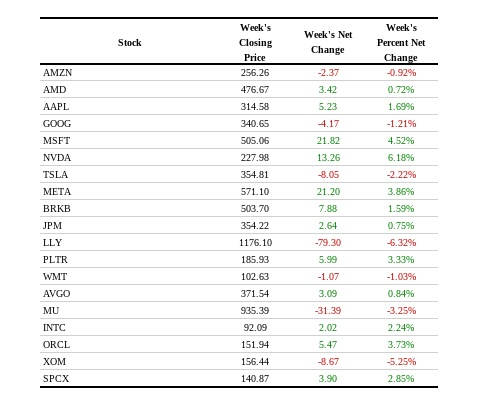
Nvidia was the week's best performer among the names we cover, up 6.18% to 227.98 after reporting Wednesday. Microsoft gained 4.52%, Meta 3.86% and Oracle 3.73%. Eli Lilly was the worst, down 6.32% to 1176.10, and Exxon Mobil fell 5.25% alongside crude.
The volatility side was unanimous. All 19 single-name VolDex readings we cover fell this week. Not most of them, not fifteen of nineteen as we saw last week, all of them.
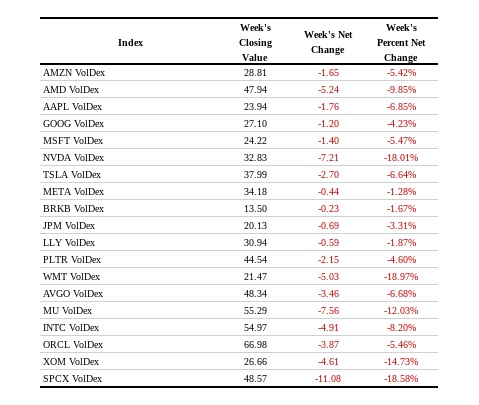
Walmart led the decline at 18.97%, down to 21.47. Nvidia was right behind at 18.01%, down to 32.83, which is the textbook post-earnings crush: the stock rose 6.18% and the options got 18% cheaper in the same week. Exxon Mobil VolDex fell 14.73% to 26.66 even as the stock dropped more than 5%, which is unusual and worth watching. Micron fell 12.03% to 55.29.
At the other end, Meta VolDex barely moved, down 1.28% to 34.18, despite the stock gaining 3.86%, and Eli Lilly VolDex fell only 1.87% to 30.94 while the stock lost 6.32%. In a week where the average name saw volatility marked down high single digits, holding roughly flat is a relative bid. Those are the two option markets not participating in the general markdown, and that is usually where the next week's story starts.
Scott's Weekly Commentary:
I keep coming back to the sequencing of this week, because it is genuinely strange. On Friday morning the new Fed chair stood up at Jackson Hole and said, in substance, that inflation is above target, that prices are the priority, and that there is more work to do. Rate futures moved toward a September hike. Two-year yields jumped eight basis points. And the option market's response was to mark down the price of downside protection across every strike from three standard deviations below the market to the money, and to buy calls one standard deviation above it.
There are two ways to read that. The charitable one is that the equity market already knew. Warsh has been consistent, the data has been consistent, and a hawkish speech from a hawkish chair is not new information. Under that reading, VolDex below 12.00 is fair for a market in the days before Labor Day and whose realized volatility has been low and whose earnings season went well.
The less charitable reading is that the equity option market is the only market in this letter that reached that conclusion. Treasury note traders bid the front week up 20% into next Friday's payrolls. Gold and silver traders tore up the call side and paid for puts. Emerging market traders bought downside while selling at-the-money. Those are three separate constituencies pricing a Fed that might actually do something, and one very large constituency pricing a Fed that will not matter. I do not think all four can be right.
The trade is not to buy volatility for its own sake, because being long a decaying asset while waiting to be proven right is how good analysis becomes a bad P&L. It is to notice that the cheapest thing on the board is exactly what you would want if the bond, metals and emerging market crowds turn out to be the informed ones. An S&P 500 put spread, financed by selling the far-upside call that didn't come down very much (as a covered call, never naked), is close to free right now and it is priced off the two ends of the distribution that moved in opposite directions this week. If you own equities and you have been waiting for protection to get cheap, it did not get cheap because the risk went away. It got cheap because nobody wanted it.
The other thing I will be watching is the Treasury note front week. It is the single dissenting data point in an otherwise unanimous set of readings, and dissent that is willing to pay for itself deserves more attention than dissent that is merely loud.
Every index in this letter updates daily for members, along with the full term structure, the Option Window and the single-name tools. Start a 30-day free trial and watch the whole surface reprice, not just the weekly summary of it.
Everyone at Nations Indexes hopes you have a healthy and profitable week.
Scott