The Weekly Takeaway:
- The S&P 500 gained 0.09% this week. It is up 12.75% for the year to date;
- The Nasdaq-100 gained 0.38% this week. It is up 17.01% for the year to date;
- S&P 500 VolDex® rose 0.77% this week to close at 11.78, which is still near the bottom of its 52-week range. You can Learn More About VolDex;
- The 10-year Treasury Note yield rose 6.4 basis points to close at 4.784%;
- Crude oil futures gained 9.38% to close at 91.22 as renewed U.S. strikes on Iran revived the risk of a wider war;
- The S&P 500 volatility measures rose almost across the board, but unevenly: PutDex® rose 3.22% while CallDex® rose just 1.57% but TailDex® fell 0.15%;
- S&P 500 RiskDex® rose 9.71% to 3.01 because the downside was bid more than the upside, not because anyone abandoned calls. You can Learn More About RiskDex;
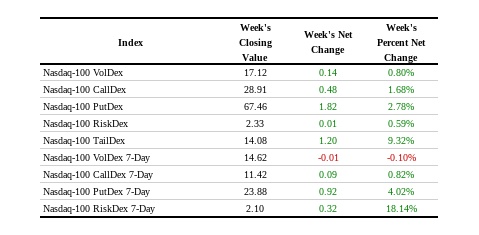
- Nasdaq-100 VolDex rose 0.80% to 17.12 and Nasdaq-100 TailDex rose 9.32% to 14.08, so the Nasdaq wings were bid even as the body barely moved;
- Treasury Bond VolDex rose 1.08% to 10.61 and Treasury Note TailDex rose 16.48% to 2.46;
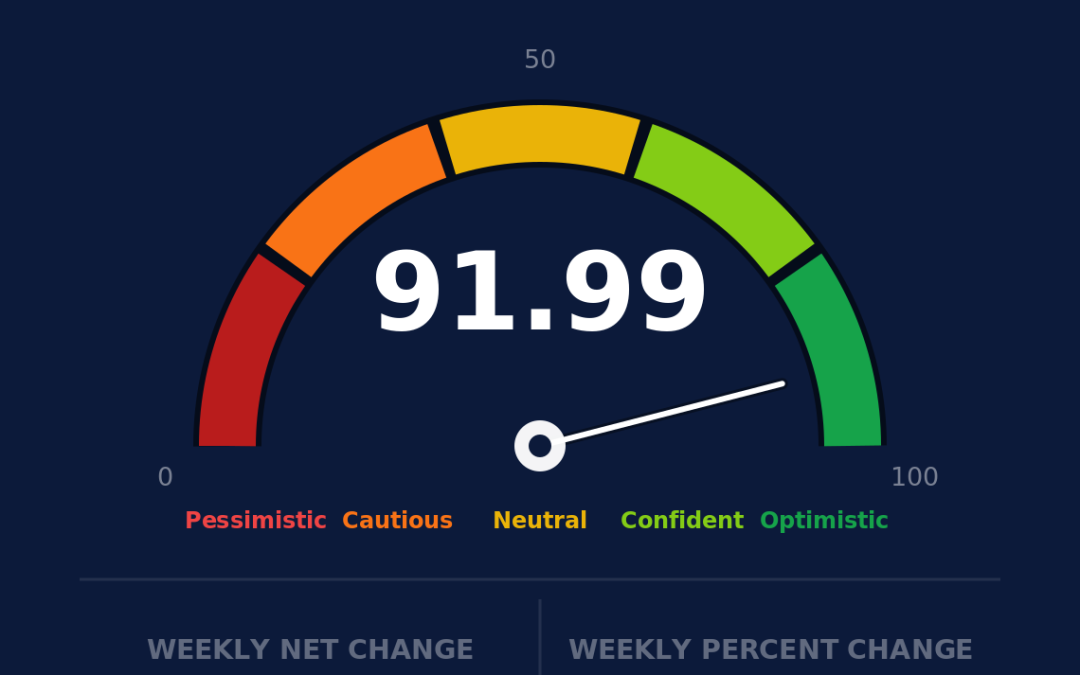
- The Nations Investor Optimism Index® slipped 0.71 to 91.99, which is still very confident;
- Single-name VolDex rose in seventeen of the nineteen names we cover, led by Micron, with Broadcom the loud exception on the other side;
- You can always learn more about all our indexes at Learn More About Our Indexes.
Equity Index Volatility:
The week the Federal Reserve question flipped from "how many cuts" to "will they hike" was, in the option market, almost a non-event. August payrolls came in at 162,000 against expectations closer to 53,000, the unemployment rate held at 4.1%, and by Friday afternoon futures had rate-hike odds for the September 15-16 meeting up around 62% from roughly 55% before the number. Stocks gave back 0.38% on Friday and still finished the week higher. The S&P 500 added 0.09%, the Nasdaq-100 added 0.38%, and the Russell 2000 added 0.11%.
S&P 500 VolDex, which measures the implied volatility of at-the-money 30-day options, rose 0.77% to close at 11.78. That is a rounding error on a week that rewrote the Fed's path, and it leaves 30-day option prices toward the low end of the range they have occupied for the past year. Nasdaq-100 VolDex rose 0.80% to 17.12. Russell 2000 VolDex actually fell 0.77% to 16.33.
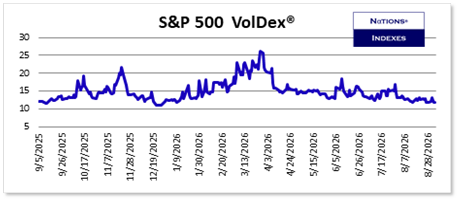
The chart is the point. Fifty-two weeks of daily closes, with two obvious episodes — last autumn and the stretch from late February into early April — and then a long, quiet slide into the summer that the last few weeks have not interrupted. A market that thought a September hike was a real possibility would ordinarily pay up for the thirty days that contain the meeting. This one did not.
Skew: The Downside Got Paid For, The Upside Got Capped
Underneath the flat headline, the shape of the surface did move. S&P 500 PutDex, our measure of out-of-the-money put pricing, rose 3.22% to 49.38. CallDex, the same measurement on the call side, rose 1.57% to 16.68. Because RiskDex is PutDex divided by CallDex, that gap pushed RiskDex up 9.71% to 3.01 although that is still well below the historical average and median values.
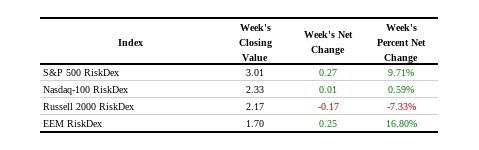
Why It Matters… Mechanism is not magnitude. RiskDex rose this week because put demand outran call demand, not because call demand disappeared — both legs were bid. That is a different market from the one we described in late August, when the front week repriced violently around a single dated worry. This week traders reached for protection at a measured pace and kept paying for upside at the same time. A skew that steepens while both wings are bid is a market adding insurance to a position it has no intention of selling.
The Nasdaq told a sharper version of the same story. Nasdaq-100 PutDex rose 2.78% to 67.46 while CallDex rose 1.68% to 28.91, and Nasdaq-100 TailDex — the deep out-of-the-money puts roughly three standard deviations down — rose 9.32% to 14.08. S&P 500 TailDex, by contrast, was flat at 12.19, down 0.15%. The crash bid this week was a technology crash bid. You can Learn More About TailDex.
Nations TermDex® Term Structure:
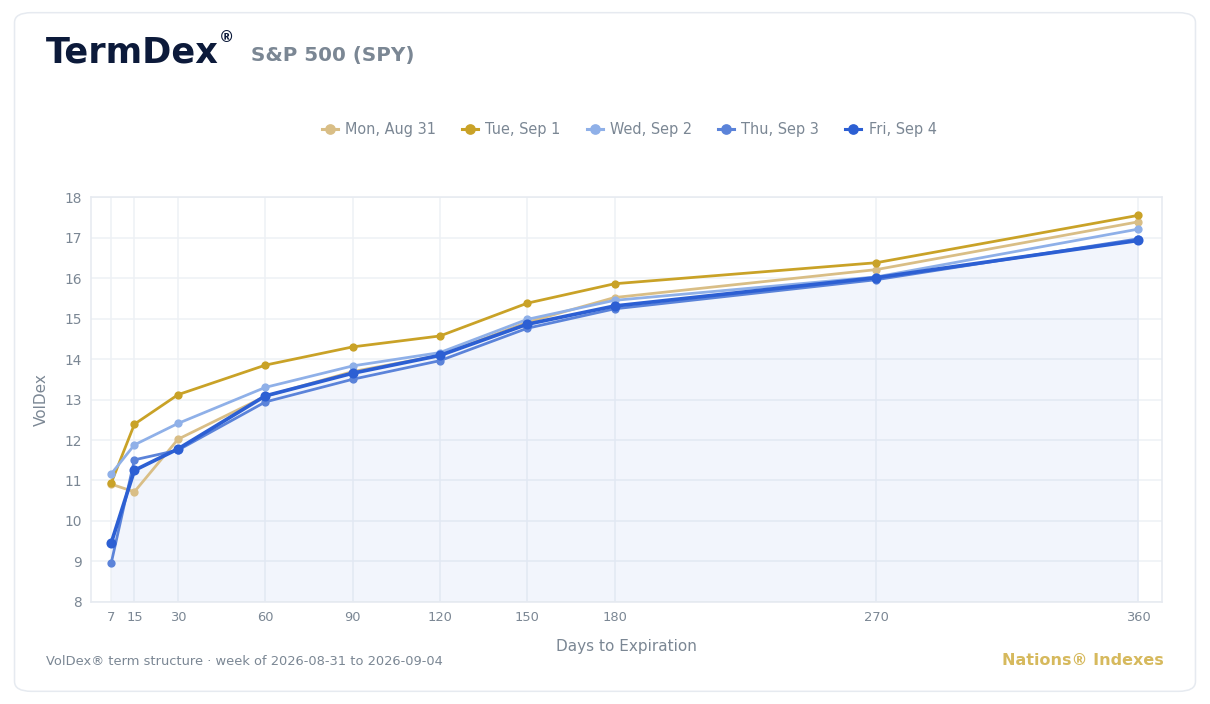
TermDex plots S&P 500 VolDex at every tenor from one week to one year. The week's five lines are tightly bunched and cleanly upward sloping, which is the normal, healthy shape. Two details are worth pulling out. First, Tuesday, September 1 was the expensive day at every tenor, and the curve drifted lower each day after it — Friday's line is the lowest of the week from fifteen days out to a year. Second, the front of the curve fell hardest. Friday's seven-day reading closed at 9.45, down 2.58% on the week, against a 30-day reading of 11.78 and a one-year reading near 17.
Read that against the calendar. The seven trading sessions after Friday's close contain both the consumer and producer price reports that most strategists now say will decide the September meeting. The option market is charging a single-digit volatility for the week that decides the Fed's next move. You can Learn More About TermDex.
Option Window®:
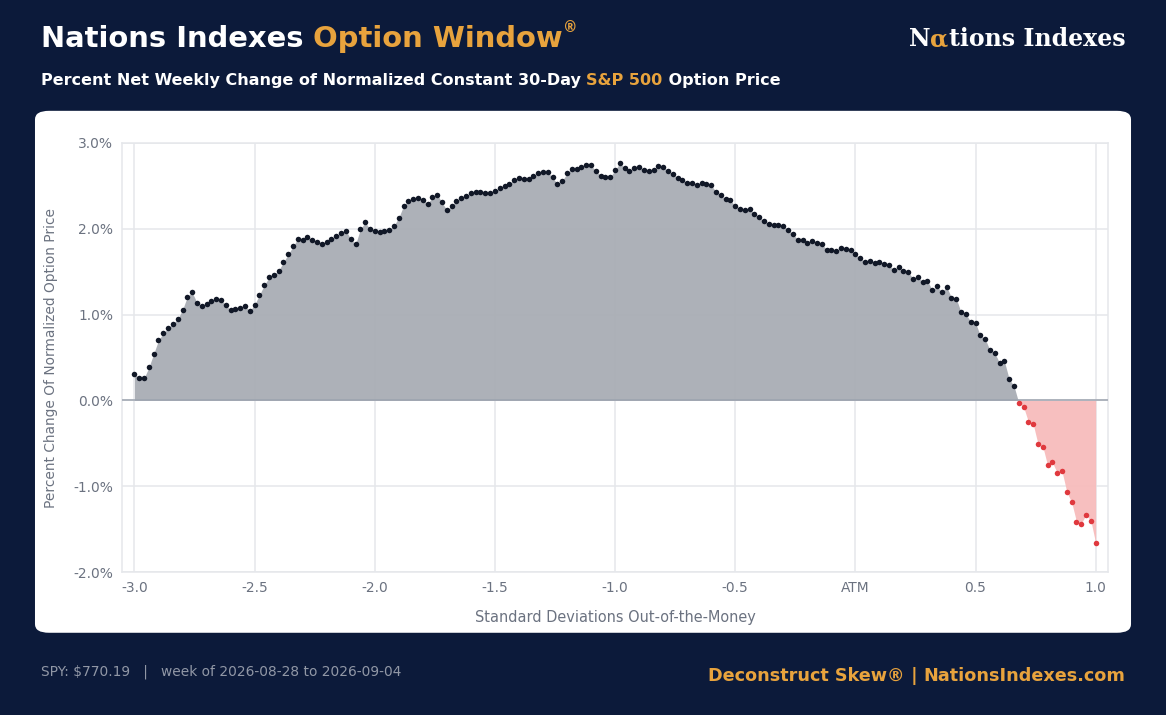
The Option Window shows the net change in the price of a normalized 30-day S&P 500 option at every strike, measured in standard deviations from at-the-money, and it already accounts for the move in the underlying since it uses constant moneyness. With SPY at $770.19, the entire downside was bid. Every strike from three standard deviations below the money up to roughly two-thirds of a standard deviation above it got more expensive, and the biggest bid — about 2.75% — sat around one standard deviation below the money.
0 DTE and 1DTE Options:
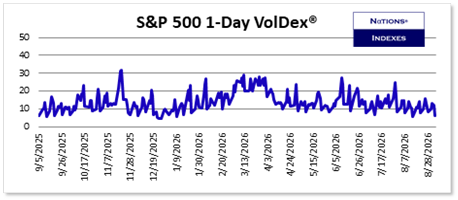
S&P 500 1-Day VolDex closed at 6.11, down 24.48% on the week. A day-of expiration option is priced for a 6% annualized move, on a Friday that had just delivered a payroll surprise of more than 100,000 jobs and moved the Fed's September meeting from a coin flip to a lean. The one-day series spends most of its life between 5 and 15 and spikes above 25 only around genuine events; 6.11 is at the quiet end of the quiet range.
There is an obvious asymmetry here for anyone who has to own something into next week's inflation data. Buying the day of the print in a market that charges this little for one-day gamma costs almost nothing to be wrong about, and the seven-day number at 9.45 says the market is not charging much more for the week around it either.
Other Asset Volatility:
Treasury Bonds and Notes:
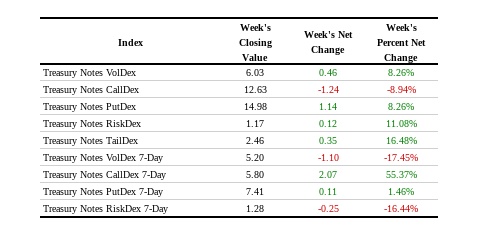
The Treasury complex is where the hawkish repricing actually showed up. The 10-year yield rose 6.4 basis points to 4.784%, and Treasury Note VolDex rose 8.26% to 6.03 — a bigger percentage move than anything the equity indexes managed. The interesting line is the skew. Treasury Note CallDex fell 8.94% to 12.63 while Treasury Note PutDex rose 8.26% to 14.98, which took Treasury Note RiskDex up 11.08% to 1.17. Traders clearly have an opinion regarding the direction Treasuries will take over the next 30 days..
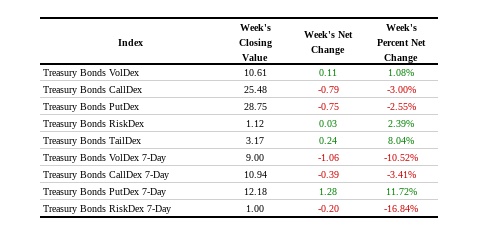
Treasury Bonds were quieter — Bond VolDex up 1.08% to 10.61, with both CallDex and PutDex slightly lower — but Bond TailDex still rose 8.04% to 3.17. Last month we noted Treasury call buying, which was positioning for bond strength (often because of expected weakness in equity prices). This week that reversed cleanly: the bond market paid up for lower prices and for the tail, which is exactly what a market that has started to price in a hike should do. When the equity option market and the Treasury option market disagree about how much the Fed matters, the bond market is usually the one to believe.
Precious Metals:
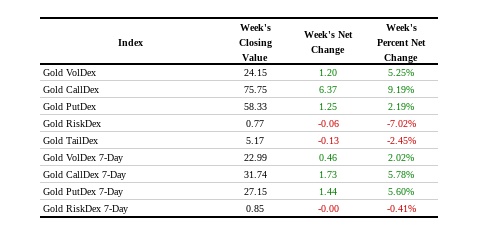
Gold futures slipped 1.08% on the week to close at 4,429.80, and gold option prices went the other way. Gold VolDex rose 5.25% to 24.15 and Gold CallDex rose 9.19% to 75.75, against PutDex up only 2.19% to 58.33. Gold RiskDex fell 7.02% to 0.77 — well below 1.00, which means out-of-the-money gold calls are meaningfully richer than out-of-the-money gold puts although, as we have noted, this is not unusual for gold.
Why It Matters…That is the mirror image of the equity surface. In stocks, traders pay for protection. In gold, after a year that has taken the metal to records, they are still paying for more upside even on a down week. A call skew that persists through a pullback is a market treating dips as entry points rather than as warnings.
Equities:
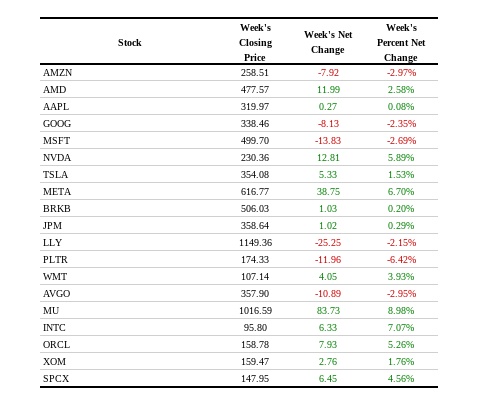
Single-name VolDex rose in seventeen of the nineteen names we cover. The two ends of the list tell the same story from opposite sides of an earnings date.
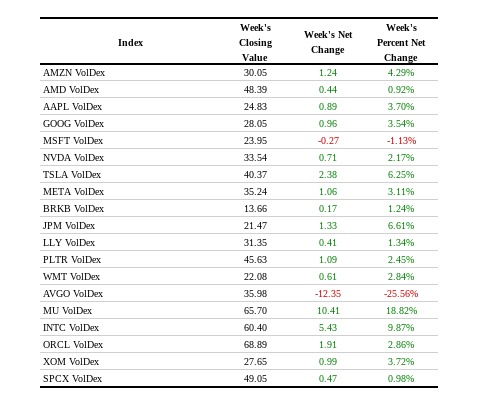
Broadcom reported after the close on Wednesday: revenue up 86%, artificial-intelligence revenue up 221%, and fourth-quarter guidance that the market judged cautious. The stock fell 2.95% on the week and AVGO VolDex collapsed 25.56% to 35.98, with the seven-day number down 52.63% to 34.86. That is a textbook post-event crush, and it is the single most reliable trade in the options market — the event premium leaves the moment the event does, whether the news was good or bad.
Micron sits at the other end of the cycle. The stock rose 8.98% to 1,016.59 on reports that contract memory prices could climb 50% this quarter, and MU VolDex rose 18.82% to 65.70. What makes it interesting is the composition: MU CallDex rose 26.86% to 201.12 while PutDex rose only 11.23%, taking MU RiskDex down 11.84% to 0.72. Rising volatility with a falling RiskDex is the signature of speculative call buying, not hedging, and Micron still has an earnings date in front of it.
Elsewhere, INTC VolDex rose 9.87% to 60.40 with the stock up 7.07%, JPM VolDex rose 6.61% to 21.47, and TSLA VolDex rose 6.25% to 40.37. Microsoft was the only other name whose VolDex fell, down 1.13% to 23.95 even as the stock lost 2.69%. Palantir was the week's worst performer at -6.42%, and its VolDex rose only 2.45% — a genuine decline in the stock that the option market treated as ordinary.
Nations Investor Optimism Index®:
The Optimism Index, built from S&P 500 VolDex, TailDex and RiskDex measured against their rolling two-year ranges, fell 0.71 points, or 0.77%, to 91.99. It remains deep in the Optimistic band, and it has now spent months there. The decline is small enough to be noise on its own, but it arrived in a week when the skew steepened while the levels barely moved — precisely the sort of internal shift a single headline number is built to surface. You can Learn More About the Optimism Index.
Scott's Weekly Commentary:
Four markets looked at the same payroll number this week and came to four different conclusions. Fed funds futures decided a September hike is more likely than not. The Treasury option market paid up for puts and for the tail. The gold option market kept paying for calls when I'd expect higher interest rates to weigh on gold. And the S&P 500 option market, the one with the most money riding on the answer, moved its 30-day price by less than one percent and marked its one-day price down by a quarter.
All four can't be right. The equity market's position is the strange one, because it is not a bet that the Fed will not hike — it is a bet that it will not matter. You can see the logic. Earnings are still growing, the artificial-intelligence capital cycle is still spending, and the last two years have taught traders that every macro scare resolves upward so they should buy the dip. But the mechanism that gets you from "the Fed might hike into a strong economy" to "30-day options should cost 11.78" is not obvious to me, and the Option Window suggests traders are not entirely comfortable with it either. They bought the whole downside. They just refused to pay for it in the at-the-money strike where it would show up in the headline number.
The practical read is that the components are mispriced relative to each other rather than the whole surface being wrong. Buying at-the-money volatility here is buying the cheapest thing offered, and the seven-day tenor at 9.45 covers both inflation prints although it also includes the 3-day weekend. And if you own single names into their earnings dates, Broadcom is this week's reminder of what happens the morning after: the premium you paid for the event leaves whether or not you were right about the news. Owning volatility into an earnings print is a difficult way to make money. But to paraphrase Mark Twain, so is being short vol into an earnings print.
Next week will be the story. The consumer and producer price reports land inside that seven-day window, the September meeting follows the week after, and an option market that has priced almost nothing for either will find out what it thinks in a hurry. Cheap protection is only cheap until you need it.
Every index in this letter updates in real time for members, along with the complete term structure, the Option Window and the single-name tools. Start a 30-day free trial and watch the surface move during the trading day instead of reading about it on Saturday.
Everyone at Nations Indexes hopes you have a healthy and profitable week.
Scott