The Weekly Takeaway:
- The S&P 500 lost 1.55% this week. It is up 8.94% for the year to date;
- The Nasdaq-100 lost 4.13% this week. It is up 13.24% for the year to date;
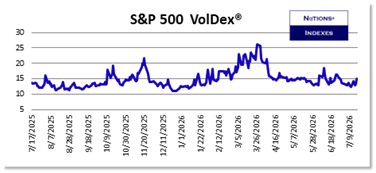
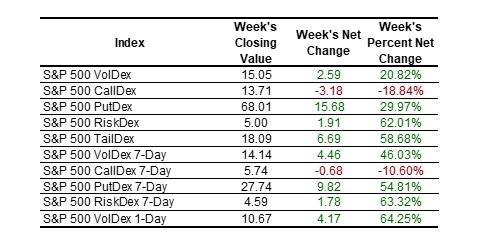
- S&P 500 VolDex (ticker VOLI) rose 20.82% this week to close at 15.05. That is the 27th percentile of its 52-week range;
- The yield on Treasury Notes fell by 2.8 basis points as the selloff in equities led to buying in treasuries. The 10-Year yield ended the week at 4.451%;
- Crude oil futures gained 13.90% to close at 81.51;
- Every S&P 500 volatility measure rose on the week with the exception of CallDex (both 7-Day and 30-Day) which fell as traders sold out-of-the-money calls to get short exposure to the S&P. CallDex measures the normalized price of the call option that is 1 standard deviation out-of-the-money (the 1 standard deviation OTM call has a 16 delta). You can learn more about CallDex at Learn More About CallDex;
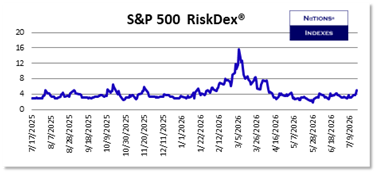
- S&P 500 RiskDex rose 62.01% and closed the week at 5.00 in an extreme display of worry. You can learn more about RiskDex at Learn More About RiskDex;
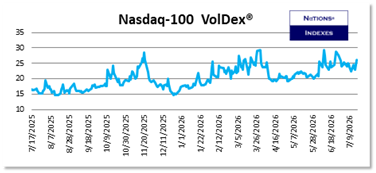
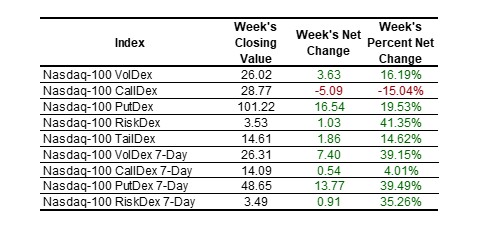
- VolDex on the Nasdaq-100 rose by 16.19% to close at 26.02 which is the 78th percentile of its 52-week range. Last week we discussed the divergence between S&P 500 VolDex and Nasdaq-100 VolDex and noted it should be a signal that traders were worried about the Nasdaq-100 significantly underperforming the S&P;
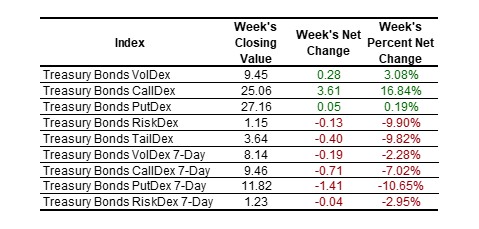
- Volatility in Treasury Bonds rose in nearly all 30-Day tenors (RiskDex fell only because CallDex rose by more than PutDex) with CallDex gaining 16.84% as traders reached for out-of-the-money calls in the face of a possible “flight to quality” from the stock market;
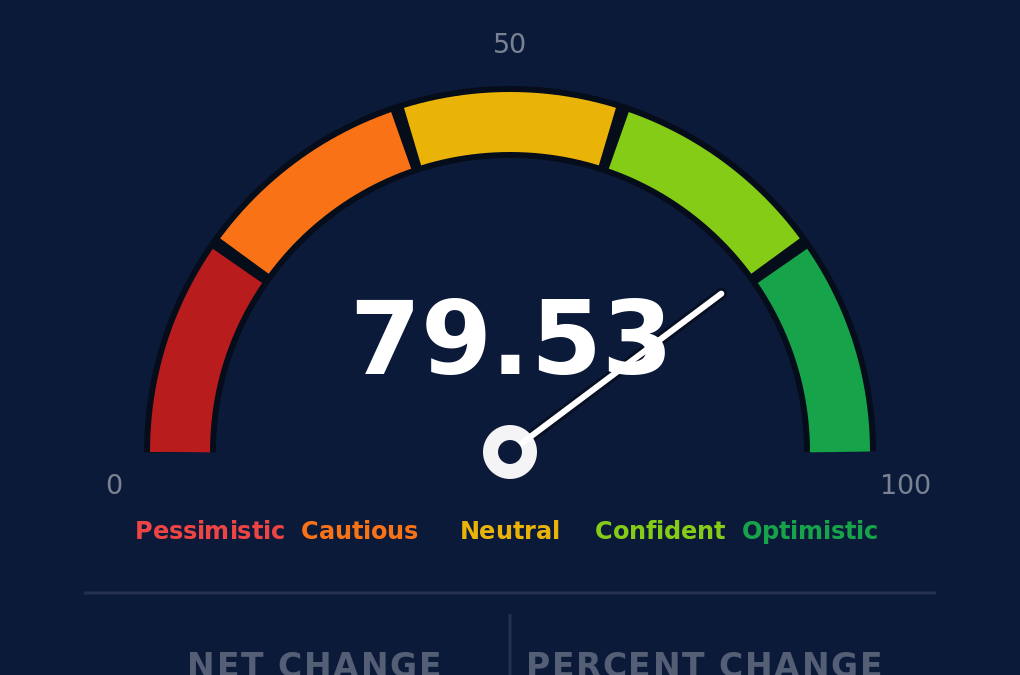
- The Nations Optimism Index® fell 12.41% for the week and closed at 79.53 which is still very confident;
- VolDex on individual stocks we follow was higher for all names with the exception of META (-2.53%) and JPM (-11.43% in the typical post-earnings volatility crush);
- You can always learn more about all our indexes at Learn More About Our Indexes.
Equity Index Volatility:
The S&P 500 lost 1.55% for the week and lost 1.01% on Friday.
S&P 500 option prices rose as you can see with only CallDex in both tenors falling as traders sold out-of-the-money calls to get short the market. The time to worry is when the market is falling and traders are buying out-of-the-money calls in a scramble to get long volatility wherever they can.
The 62.01% rally in RiskDex is striking because it signals a shift from a slightly bullish point of view to a decidedly bearish one. This RiskDex close of 5.00 puts it at approximately the 82nd percentile of its complete history going back to 2005.
Traders have to have this kind of insight to understand what the option market is saying and to craft the best possible trade structures. You can learn more about RiskDex at Learn More About RiskDex;
Historical metrics (Average, median, 10th percentile, 25th percentile, 75th percentile, and 90th percentile) for all our indexes are available to subscribers at NationsIndexes.com.
Why It Matters…Historical data for all our indexes is available to subscribers at the Everything! level and they allow option traders to understand the context of the current option pricing environment. You have to understand what normal is in order to do so.
Nasdaq-100 VolDex rose by 16.19%.
You can learn more about VolDex at Learn More About VolDex.
Last week we mentioned the divergence between S&P 500 VolDex and Nasdaq-100 VolDex and the market delivered on that promise this week with the Nasdaq-100 losing more than 2 and a half times what the S&P lost this week.
Every Nasdaq-100 volatility measure rose on the week with the exception of 30-Day CallDex. Even 7-Day CallDex rose (4.01%) so there is reason to worry that traders were reaching to buying short-dated volatility in the Nasdaq-100 wherever they could get it.
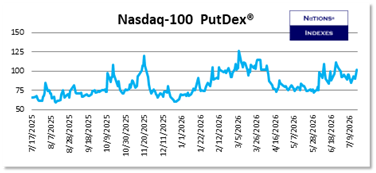
You can learn more about PutDex at Learn More About PutDex.
Why It Matters…Traders have to have the objective data provided by our indexes to trade in a way that doesn’t rely on hunches or guesses.
Investor Optimism Index®:
The Investor Optimism Index® fell by 12.41% to close at 79.53 meaning traders remain confident regarding the next 30 days despite this week’s price action.
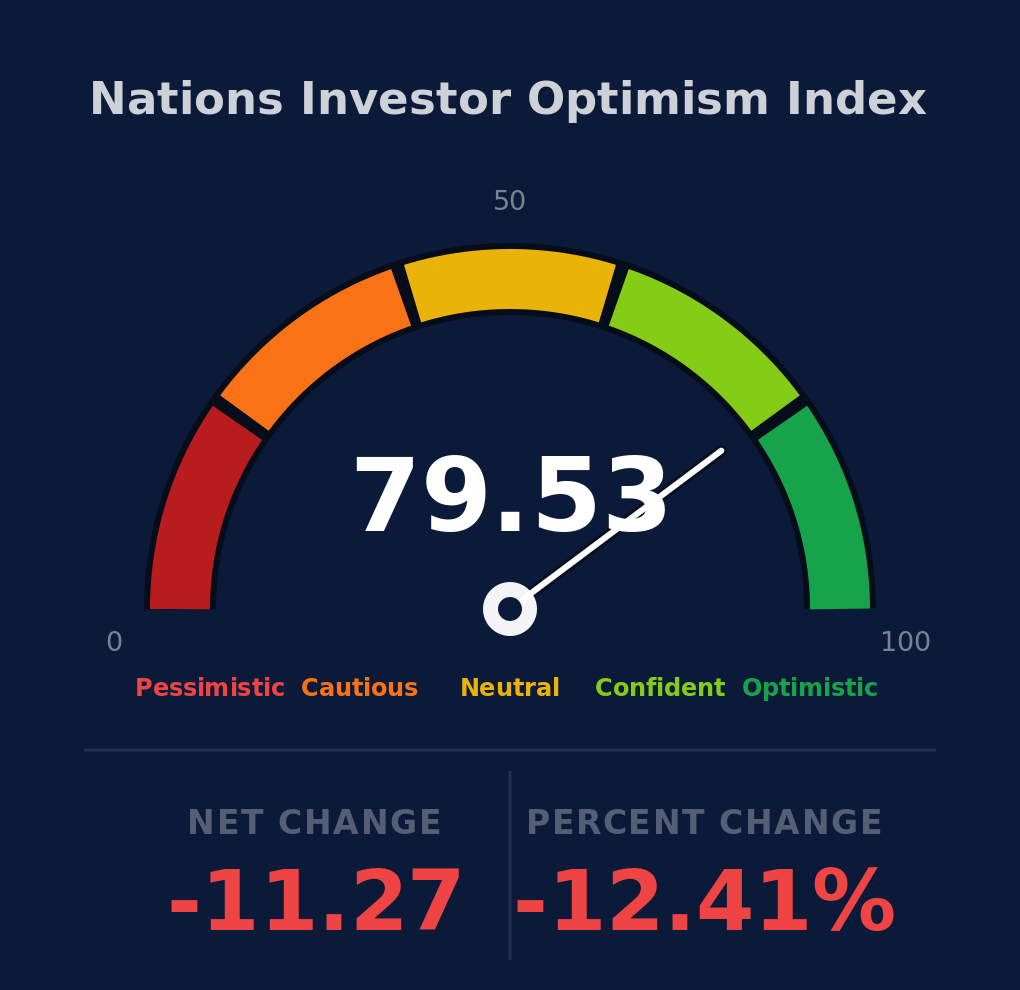
The index takes into account the current levels of S&P 500 VolDex, TailDex, and RiskDex and compares them to their rolling 2-year ranges. It is plotted on a 0 to 100 scale.
Our Optimism Index is now available in real-time on our home page at Nations Optimism Index.
TermDex® VolDex Term Structure:
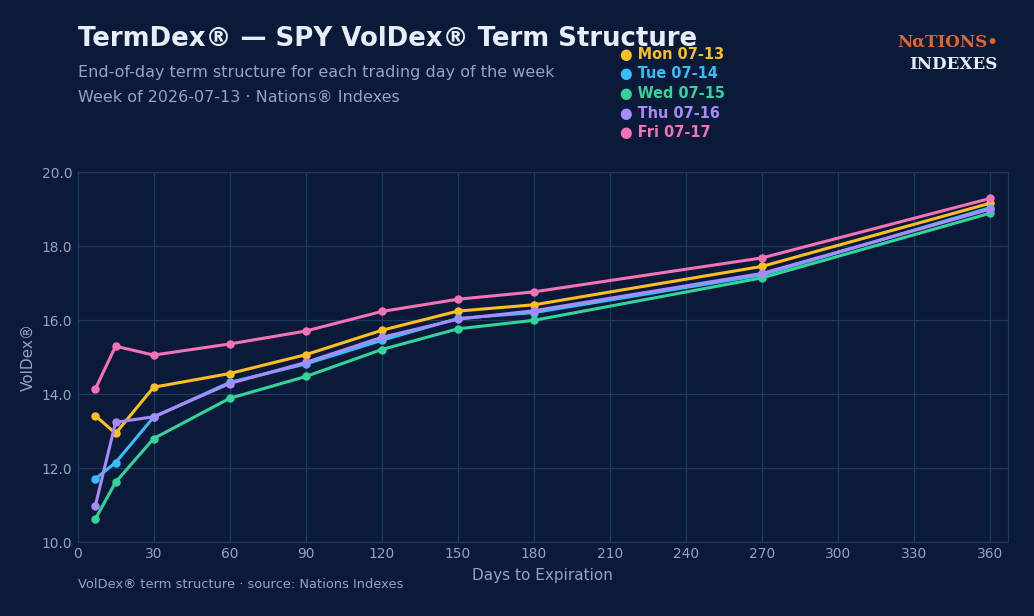
The Nations TermDex® measure of VolDex term structure illustrates S&P 500 VolDex for various tenors. It provides insight into both near-term and longer-term expectations for volatility in the S&P 500.
Term structure at the close on Friday was upward sloping signaling there is still relatively little concern over the next 7-15 days.
0DTE and 1DTE Options:
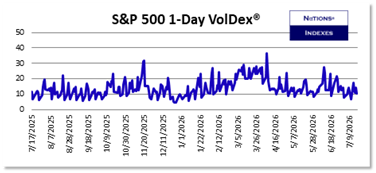
S&P 500 1-Day VolDex rose 64.25% this week to close at 10.67 as traders worry about news from the Persian Gulf this weekend.
Very short-dated volatility measures which use a variance swap methodology, as 1-day VIX does, inject significant error into the resulting measure because of the way out-of-the-money options trade in the hours before expiration. The VolDex at-the-money methodology is particularly suited for these very short-dated tenors.
Other Asset Volatility:
Treasury Bonds and Notes:
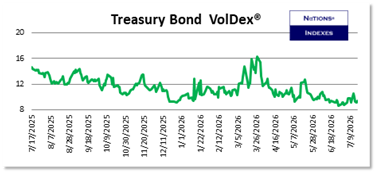
Bond and Note yields eased on Friday as the money that left the equity markets found a new home in treasuries. 30-Day volatility metrics gained on the week while the passage of inflation data pushed 7-Day volatility metrics lower.
Precious Metals:
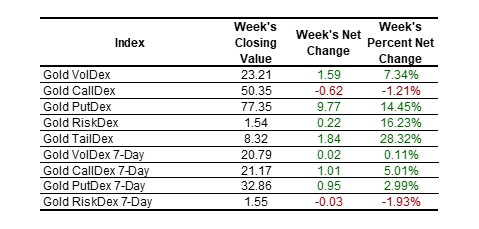
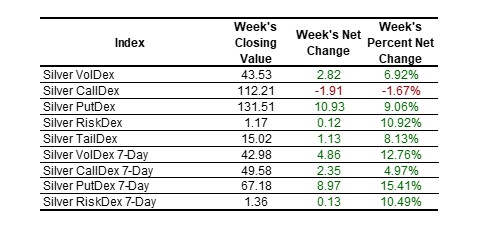
Gold fell 2.49% this week and silver fell 6.33%.
Equities:
VolDex was generally higher for the names we cover as you can see although we’ve added MU, XOM, INTC, ORCL and SPCX to our coverage universe and we’ll including them in future editions of Volatility Insights.
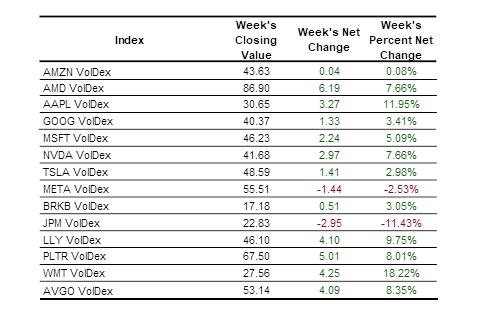
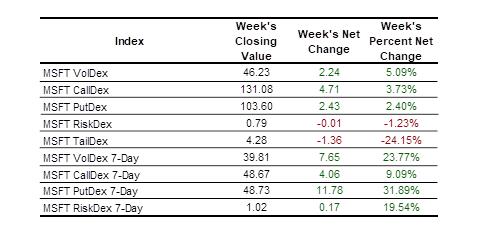
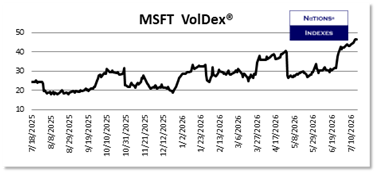
Volatility metrics fell off for JPM because of the passage of the earnings catalyst but it rallied in the technology names and has reached extreme levels for several names. Traders should be paying close attention. MSFT VolDex is at the top of its 52-week range. This week’s close of 46.23 is the 91st percentile of the last 6 years so while MSFT VolDex has ramped in front of earnings, as we would expect, it has done so to an extraordinary degree.
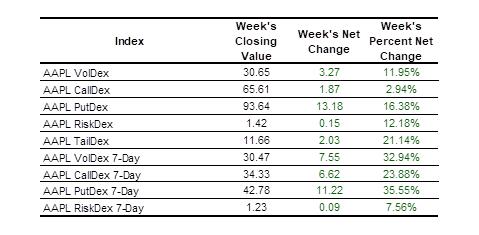
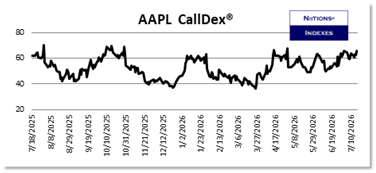
It is also interesting that, despite the week’s selloff in technology names, AAPL gained 5.84% and got into “overbought” territory with a relative strength index (RSI) reading of 71.65. At the same time, AAPL CallDex closed the week at 65.61, an increase of 2.94% and the 81st percentile of its 52-week range. All the volatility metrics in AAPL gained on the week as you can see. AAPL is set to report earnings on July 30. With CallDex at an elevated level and the shares overbought, selling a covered call or selling a call spread is attractive.
We’ll continue to comment during the week via our X account, @Nations_Indexes
Scott’s Weekly Commentary:
Last week I noted that “The renewal of hostilities with Iran hasn’t received the notice it deserves” but that seems to have changed as crude oil gained 13.90% on the week. We are hip-deep in this problem and the administration is learning, as others have before it, that asymmetrical warfare makes the sort of resolution you’d expect from the world’s most powerful military problematic. I believe a satisfactory resolution before the end of summer is unlikely. Despite this week’s comforting inflation news, that respite is likely to be temporary. That will make things difficult for fixed income and precious metals as higher inflation makes each less valuable.
In our equity markets, traders are bidding up volatility in a number of names that are due to report earnings within the next 30 days (META, MSFT, AMD) but not in all names (GOOG and PLTR). This is the sort of insight that traders pay attention to and I’ll be paying attention to this situation during the coming week.
I hope you have a safe and profitable week.
Scott