Tesla’s most ardent fans are beginning to lose faith — and I was demonized for pointing it out. When I warned on March 25 on CNBC.com that Tesla shares looked vulnerable, the reaction was swift and angry. After all, investors love Elon Musk and I understand why; he’s wealthy beyond belief, charismatic, and iconoclastic. But being wealthy, charismatic, and iconoclastic doesn’t automatically make the stock of the company someone founded a “buy.”
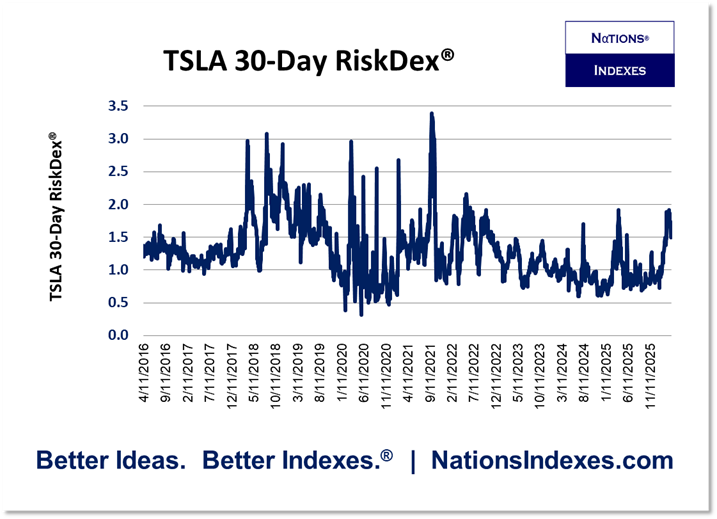
The Nations RiskDex index, which tracks the ratio of out-of-the-money put prices to out-of-the-money call prices, was flashing a clear warning for TSLA. A reading above 1.00 signals more implied downside than upside. TSLA RiskDex closed at 0.93 on January 30 — puts were cheaper than calls. By March 24, it had spiked to 1.85 — nearly double its January level — meaning puts had become 85% more expensive than calls. In short, traders were paying up for protection.
Since the end of 2019, TSLA RiskDex has spent considerable time below 1.00 meaning protective puts were cheaper than bullish calls. The stock performed admirably during that period — gaining 714% — so the bullishness expressed by options made sense. But the shares have also had sickening episodes along the way; from November 2021 to February 2023, they fell more than 75%. And since last December, they’ve dropped 30%. They’re down 12.1% in the seven trading days since my CNBC piece was published, while the S&P 500 is off just 0.6%.
In that piece, I noted that not only were TSLA options flashing a warning, but the shares were extremely expensive by any valuation measure. At that time, Tesla’s forward PE was 190 and its market cap equaled the combined market cap of all other publicly traded automakers — just as the EV space was contracting and Waymo was cementing its lead in autonomous vehicles. Yet readers hated the objective truth that the option market was signaling that TSLA shares were likely headed for a pullback.
I welcome disagreement. Markets thrive on opposing views, and after two decades in the trading pits of Chicago have a thick skin. What struck me wasn’t the bullishness some readers embraced but their absolute confidence that Tesla shares could only go higher. One person on X replied that they had “never been more bullish on Tesla.”
I believe that confidence stems more from admiration for Elon than conviction about Tesla’s prospects. This isn’t respect for an executive’s management ability — it’s blind faith. Economists call the phenomenon Phantastic Objects (sic), one of the behavioral mistakes I discuss in The Anxious Investor. It’s the emotional belief that buying products from, or owning shares in, a company run by a charismatic founder brings an investor emotionally closer to that person. It’s as if owning TSLA shares makes an investor feel like they’re partners and friends with Elon himself.
Loyalty is fine, but Elon isn’t going to invite you over for a beer just because you own 1,000 shares of TSLA. Nor does loyalty justify a forward P/E of 190 when the options market is flashing a warning and the EV space is slowing while Waymo extends its lead in autonomy.
I remember investors feeling the same way about Steve Jobs when Apple was at its peak. Denizens of Silicon Valley adored Jobs and copied his mannerisms, his blunt approach, even his wardrobe — Elizabeth Holmes of Theranos had a closet full of black turtlenecks for a reason. Some investors bought AAPL shares out of pure emotion. It worked out for some but cost others dearly when they bought at the top.
The lesson is simple: objective data is critical. Emotion has its place — but not in investing. Markets reward discipline, not devotion. Emotion drives great stories but terrible trades.
You can follow me on X at X.com/ScottNations or follow NationsIndexes at X.com/Nations_Indexes.
Scott