The Weekly Takeaway:
- The S&P 500 gained 0.65% this week. It is now up 8.56% for the year;
- The Nasdaq-100 gained 2.34% this week. It is now up 17.37% for the year;
- The yield on Treasury Notes fell by 4.9 basis points this week and closed at 4.487%;
- Crude oil futures fell by 6.74% this week as traders expect an agreement ending the war with Iran;
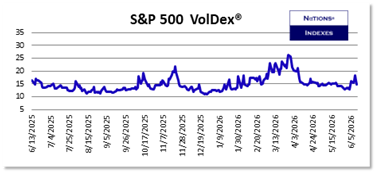
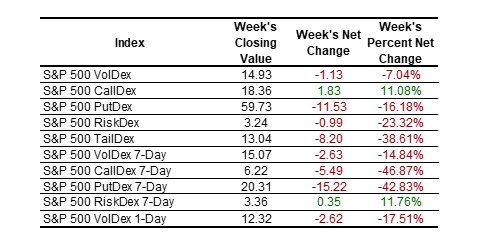
- S&P 500 VolDex (ticker VOLI) fell by 7.07% to close at 14.93;
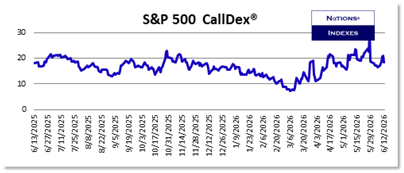
- Nearly every S&P 500 volatility measure fell as fear ebbed. 30-Day CallDex rose by 11.08% as traders bought out-of-the-money calls to get long exposure. You can learn more about CallDex at Learn More About CallDex;
- VolDex on the Nasdaq-100 fell by 3.64%;
- Nasdaq-100 CallDex was the only Nasdaq-100 volatility metric to rise on the week. It gained 10.28%;
- Volatility in Treasury Bonds fell this week with Treasury Bond VolDex losing 7.84% and closing below 10.00;
- The individual equities we cover were mixed this week. AMD was the big winner (+9.69%) while MSFT was the big loser (-6.22%);
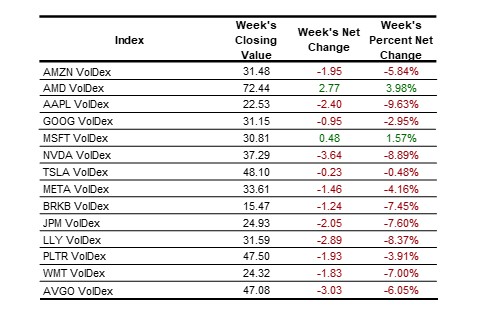
- VolDex on individual stocks was generally lower as fear ebbed. It was higher in just AMD (+3.98%) and MSFT (+1.57%);
- You can always learn more about all our indexes at Learn More About Our Indexes.
Equity Index Volatility:
The S&P 500 gained 0.65% on the week after losing 1.62% on Wednesday and gaining 1.75% on Thursday.
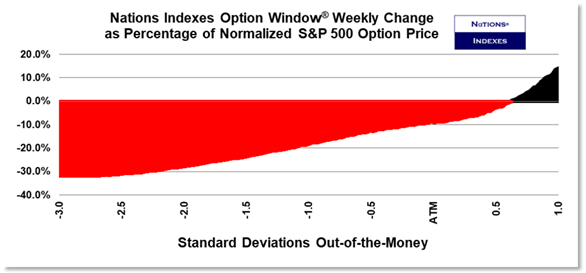
S&P 500 option prices generally fell as you can see below. It is worth noting that traders rushed in to buy out-of-the-money calls again.
S&P 500 VolDex closed on Friday at the 28th percentile of its 52-week range. CallDex closed at the 49th percentile of its 52-week range so traders are favoring out-of-the-money calls.
Historical metrics (Average, median, 10th percentile, 25th percentile, 75th percentile, and 90th percentile) for all our indexes are available to subscribers at NationsIndexes.com.
Why It Matters…Historical data for all our indexes is available to subscribers at the Everything! level and they allow option traders to understand the context of the current option pricing environment. You have to understand what normal is in order to do so.
As mentioned above, Nasdaq-100 VolDex fell by 3.64% to close at 24.64. That is the 69th percentile of its 52-week range so the vol regimes for the S&P 500 and Nasdaq-100 are very different
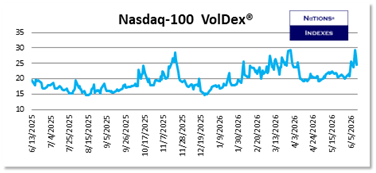
You can learn more about VolDex at Learn More About VolDex.
Nasdaq-100 CallDex gained 10.28% for the week and closed at 40.66, the 66th percentile of its 52-week range.
Nasdaq-100 RiskDex fell by 17.43% to close at 2.21, the 9th percentile of its 52-week range demonstrating significant bullishness on the part of tech traders.
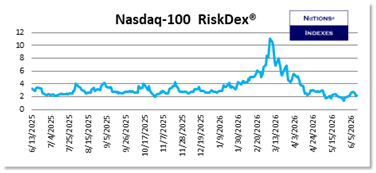
You can learn more about RiskDex at Learn More About RiskDex.
Why It Matters…Traders have to have the objective data provided by our indexes to trade in a way that doesn’t rely on hunches or guesses.
Investor Optimism Index®:
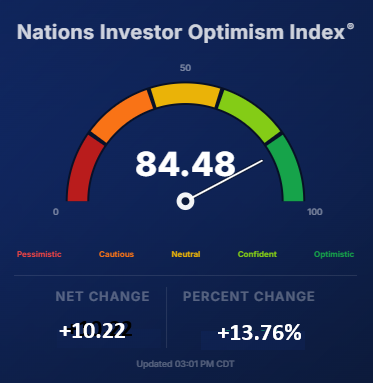
The Investor Optimism Index® rose by 13.76% to close at 84.48. Traders remain very optimistic regarding the next 30 days.
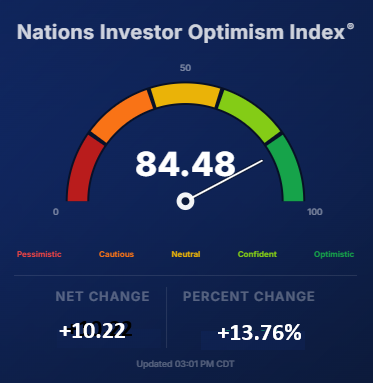
The index takes into account the current levels of S&P 500 VolDex, TailDex, and RiskDex and compares them to their rolling 2-year ranges. It is plotted on a 0 to 100 scale.
Our Optimism Index is now available in real-time on our home page at Nations Optimism Index.
Option Window®:
S&P 500 Option Window fills in the blanks between TailDex, PutDex, VolDex, and CallDex and reveals how trade flows were driving option prices. Since Option Window calculates normalized option prices at fixed points of moneyness any changes are driven by option flows rather than movement in the underlying S&P 500.
Option prices were lower across the bulk of the skew and were only higher on the week above 0.6 standard deviations above at-the-money. That corresponds to approximately 7600 in the S&P.
Term Structure:
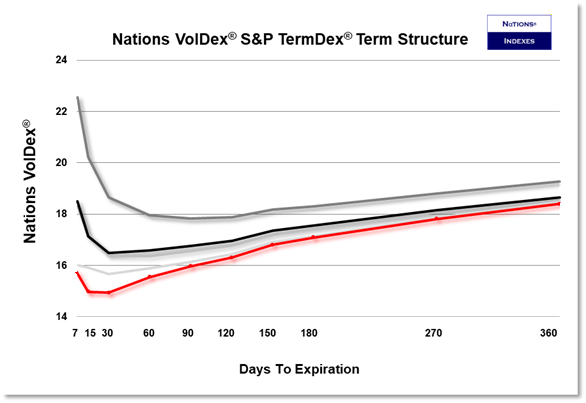
The Nations TermDex® measure of VolDex term structure illustrates S&P 500 VolDex for various tenors. It provides insight into both near-term and longer-term expectations for volatility in the S&P 500.
Term structure at the close on Friday (in red) was lower across all tenors but the upward kink for the 7- and 15-day tenors signal that traders are bullish (CallDex was higher) but remain a little fearful.
1DTE Options:
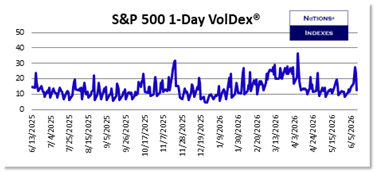
S&P 500 1-Day VolDex fell by 17.51% to close at 12.32.
Very short-dated volatility measures which use a variance swap methodology, as 1-day VIX does, inject significant error into the resulting measure because of the way out-of-the-money options trade in the hours before expiration. The VolDex at-the-money methodology is particularly suited for these very short-dated tenors.
Other Asset Volatility:
Treasury Bonds and Notes:
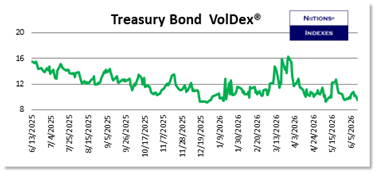
Bond and Note yields fell back slightly so volatility fell in unison. Treasury Bond VolDex fell by 7.84% and closed at 9.59, well below 10.00. Friday’s close is just the 7th percentile of the 52-week range so bond volatility remains very low. All directional trades in Treasury Bonds should be expressed using long positions in at-the-money options.
Precious Metals:
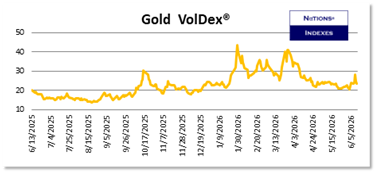
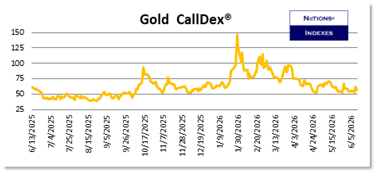
Gold fell again this week, losing 2.30% thanks to a loss of 4.36% on Wednesday. Gold volatility also fell but CallDex managed to gain 2.76%. It is odd and worth noting that CallDex rose while gold itself and other vol mertrics fell.
Bitcoin:
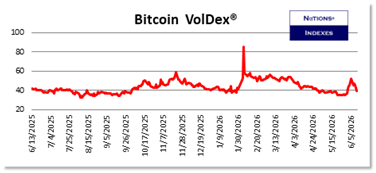
Bitcoin stopped its slide and gained 4.29% after getting hammered last week and losing 17.45%. Bitcoin volatility eased in response across the skew and term structure. We have often noted traders’ willingness to short Bitcoin VolDex when it is above 50 and that was again the case although the market did not give traders long to take advantage.
Equities:
We have expanded the list of single names we cover to include not only the most dynamic stocks in the S&P 500 and the stocks with the highest option volume, but also the largest names in the S&P 500.
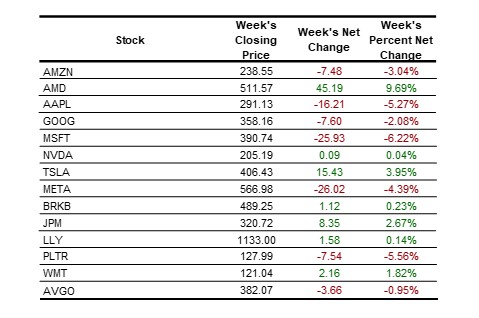
The names we cover were mixed with AMD doing well but other AI names losing ground including AAPL (-5.27% on the back of lackluster reviews for the new Siri), META (-4.39%), and PLTR (-5.56%).
VolDex was generally lower as the market recovered from the previous week’s worries.
We have recently noted that AAPL was overbought (RSI was at 79 as recently as May 29th) and shares have fallen 8.28% from their recent high. AAPL PutDex is at the 26th percentile of its 52-week range so puts are relatively cheap but with the current RSI at 44 the shares are now slightly oversold. That bearish trade was profitable for readers and we’ll revisit when the next trade is more compelling.
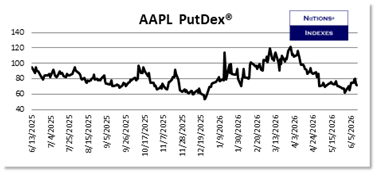
You can learn more about PutDex at Learn More About PutDex.
We’ll continue to comment during the week via our X account, @Nations_Indexes.
Scott’s Weekly Commentary:
The market bounced back impressively and the Nasdaq-100 led the way. What is interesting is the difference in the volatility regime between the S&P 500 and Nasdaq-100. S&P VolDex is at the 26th percentile of its range while Nasdaq-100 VolDex is at the 69th percentile of its range. Clearly the market expects tech and AI names to be bouncing around this summer even though that is usually a quiet spell.
The SpaceX IPO blasted off (sorry)! I understand why people want to jump on the Elon bandwagon but I don’t see how the company can grow into its current valuation of 113x trailing revenue. I won’t be a buyer any time soon although the options are expected to start trading next week and that will be fascinating.
I hope you have a safe and profitable week.
Scott