
Your Week’s Volatility Market Commentary — Information Is Your Edge
The Weekly Takeaway:
- The S&P 500 fell by 0.98% for the week despite a gain of 1.59% on Friday. Two-thirds of Friday’s rally took place in the last 25 minutes of the trading day;
- The Nasdaq-100 fell by 3.38% for the week as technology and AI names continued to come back to earth following last year’s furious rally;
- VolDex (ticker VOLI) rose 9.15% on the week to close at 15.74. It is now at the 34th percentile of its 52-week range;
- TailDex (ticker TDEX) fell by 21.00% to close at 14.33 after rising 38.29% in the previous week. It is now at just the 22nd percentile of its 52-week range. TailDex on the Nasdaq-100 fell by 6.09% to close at 14.87. That is the 37th percentile of its 52-week range;
- Expectations for upside in the S&P rebounded slightly on the week with CallDex gaining 11.64% but that is from the lowest level of the previous 52 weeks. It closed at 14.33, the 14th percentile of its 52-week range;
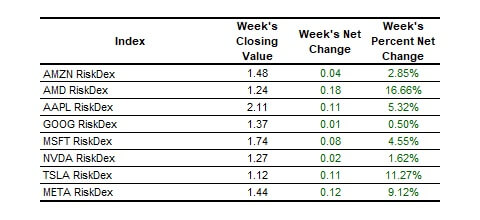
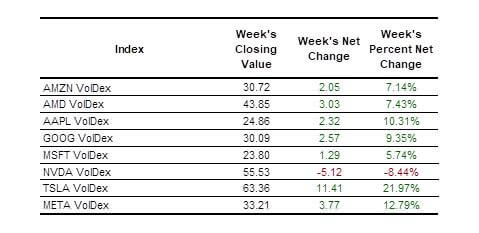
- Every single name we cover fell on the week with TSLA losing another 13.27% and NVDA losing 7.07%. VolDex on the names we cover rose with the exception of NVDA which saw volatility fall in a post-earnings volatility crush. VolDex on TSLA rose by 21.97%;
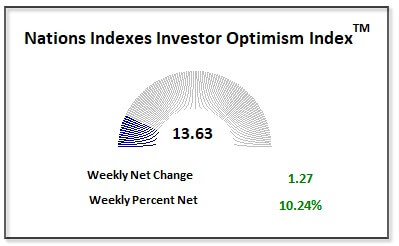
- The Nations Investor Optimism Index rose 10.24% to close at 13.63. The Index rose despite the break in the S&P only because it ended the previous week at a very low level and TailDex fell 21.00% this week.

Equity Index Volatility:
The S&P was saved from a dismal week by a 61.71 point rally during the final 25 minutes of trading on Friday. Prior to that brief stretch, the index had lost ground 3 of the 4 days of the week although Wednesday’s gain was just 0.01%.
The Nasdaq-100 lost 3.38% after losing 2.26% in the previous week as technology and AI fell from elevated levels. The S&P is just 3.14% below its 52-week high versus 6.02% for the Nasdaq-100. But NVDA is 18.42% below its 52-week high, and was more than 20% below that level at several points during the week. TSLA is 40.03% below its high and AMD is 56.07% below its 52-week high. Nearly all the single names we cover are more than 10% below their 52-week highs. The exceptions are AAPL (-7.02%) and META (-9.81%).
The result has been the expected increase in option cost. However, VolDex and TailDex are both well below the midpoint of their recent ranges in both the S&P and Nasdaq-100.
The only signs of distress are elevated RiskDex levels. While S&P RiskDex closed at 4.79, that’s just the 44th percentile of its range. The week’s most interesting action was in RiskDex on the Nasdaq-100 which fell slightly (-2.56%) as out-of-the-money call buying outpaced put buying. Much of this is likely speculators placing defined-risk trades in expectation of a bounce. It is also a recognition that Nasdaq-100 RiskDex is at the 74th percentile of its 52-week range.

We’ll continue to watch CallDex because call option prices remain very low. We continue to recommend that investors consider buying call options as a stock replacement strategy in the S&P and that bulls use calls to generate upside exposure rather than buying shares.

The volatility picture in the Nasdaq-100 was surprisingly calm given the index lost 3.38% for the week and has lost 5.82% since February 19.


And below you can see the week’s price action for RiskDex on all the individual names we cover. You’ll note that all values rose.
Astute traders can continue to take advantage of the bullish outlook in these names regardless of their own thesis. Collars remain attractive for skittish shareholders while call spreads which buy at-the-money calls and take advantage of the high relative cost of out-of-the-money calls are attractive for bulls.
Below you can see the broader levels of S&P option volatility.
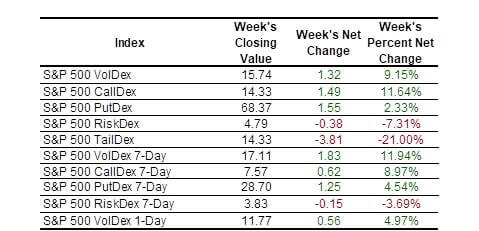
Why It Matters…RiskDex remains elevated in the S&P (the average closing value since 1/30/2005 is 3.75 and the median closing price is 3.42). But it is important to remember this increase in RiskDex is a function of call prices falling more so than put prices rising.
Systematic call selling strategies in the S&P are partly to blame. We believe these out-of-the-money call option prices have been depressed such that they are now selling at levels very near their ultimate value. In other words, we believe the long-term volatility risk premium for these options is very near zero.
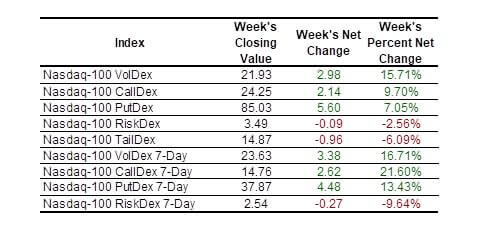
We’ll continue to pay special attention to TailDex since it signals the market’s concerns about a steep drop or “tail event”. Its decline in all equity indexes this week is noteworthy.
Nations Investor Optimism Index:
The Investor Optimism Index rose slightly albeit from a very low level. The index closed the week at just 13.63 on a scale of 0 to 100.
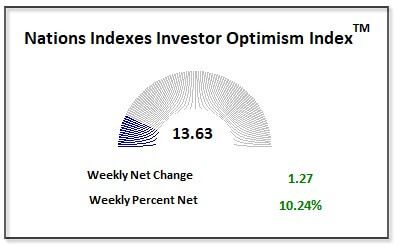
The index takes into account the current levels of S&P VolDex, TailDex, and RiskDex and the index rose, despite the S&P losing 0.98% on the week, because RiskDex fell slightly and TailDex fell by 21.00%.
The Index has not closed above 50 since January 24.
The Index spends little time at extremes with only 11.90% of all closing values below 20. It is even rarer for the index to show extremely high levels of optimism; only 9.98% of all closing values are above 80. Low levels of optimism are a contrarian indicator. The average return for all 20 trading day periods since 1/31/2007 is 0.90% while the average return for subsequent 20 trading day returns after the index has closed below 20 is 1.48%.
Deconstructing Skew:
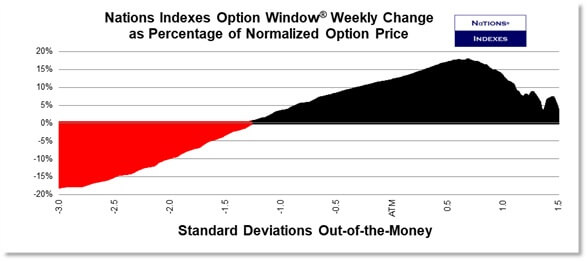
We deconstruct S&P option skew to understand what the option market is really saying. Since VIX includes nearly all strike prices listed in the relevant expirations, it is impossible to know what is driving changes in VIX – is VIX higher because traders are optimistically reaching for call options or is it higher because they’re afraid and are buying puts?
Why It Matters…This week’s Option Window is instructive. Traders were sellers of options below the point that is 1.28 standard deviations below at-the-money (approximately $559 in SPY) and buyers of everything above that level. The lesson seems to be that traders expect a reasonable amount of volatility during the next 30 days and are buying volatility while also taking advantage of very cheap out-of-the-money call prices. But they have less fear about a severe decline or tail event. This may be due to more certainty about tariffs.
Other Equity Indexes:
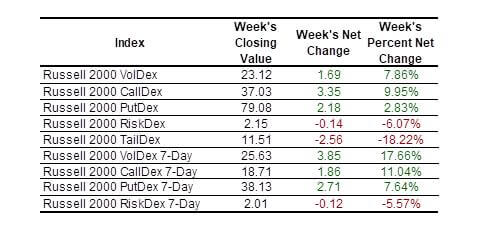
The Russell 2000 index of small capitalization stocks fell by 1.47% for the week.
Other Asset Volatility:
Treasury Bonds:
The yield on 10-year treasury notes fell from 4.420% to 4.231%. That is the lowest close for the year. The decline was driven by expectations that economic growth is slowing and a move from equities to bonds as equity prices continued to fall this week.
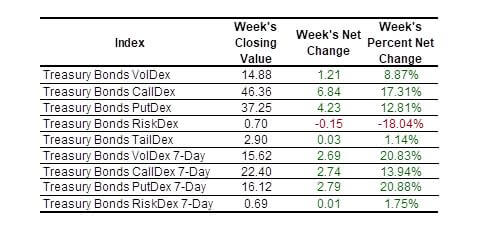
Our Dexes on treasury bonds rose with VolDex gaining 8.87%. CallDex gained 17.31% after last week’s gain of 9.89%. RiskDex closed at 0.70, down 18.04% as traders race to buy call options as rates fall and bond prices rise. Treasury Bond RiskDex is at just the 18th percentile of its 52-week range while CallDex is at the 49th percentile of its range. As we have said recently, owning treasury bond calls or call spreads can be a good way to hedge an equity portfolio.

You’ll notice the recent rally in treasury bond CallDex but it remains in the middle of its recent range.

Call skew in treasury bond options increased this week as you can see below.

All Dexes on treasury bonds increased with the exception of RiskDex which fell because call prices rallied more than put prices. Treasury bond VolDex closed at the 41st percentile of its 52-week range with CallDex closing at the 49th of its.
Bitcoin:
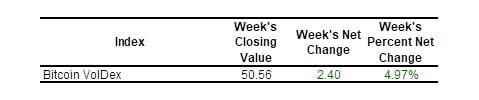
VolDex on bitcoin rose slightly despite bitcoin falling in price by 11.16%.
Bitcoin VolDex staging such an anemic rally in the face of substantial volatility in bitcoin prices suggests bitcoin options are still seeking an equilibrium level and it is likely to be below 50.
0DTE and 1DTE Options:
Zero day to expiration (ODTE) options continued to account for the majority of SPY option volume, with 54.51% of this week’s SPY option trading being 0DTE. As we pointed out last week, 0DTE SPY volume no longer falls off dramatically when prices are particularly volatile.
Very short-dated volatility measures which use a variance swap methodology, as 1-day VIX does, inject significant error into the resulting measure because of the way out-of-the-money options trade in the hours before expiration. The VolDex at-the-money methodology is particularly suited for these very short-dated tenors.
1-Day VolDex rose by 4.97% for the week.
Equities:
This week’s news was again universally bad for the individual names we cover as you would expect during a week when the NDX falls 3.38%.

NVDA fell post earnings due to unrealistic hopes on the part of many investors. The stock is still up 60.85% over the past year but is now down 6.98% YTD. AAPL continues to be the most defensive name among the ones we cover. TSLA is up 45.01% for the past 52 weeks but is now down 27.45% YTD as shares are buffeted by Elon Musk’s involvement in politics.
VolDex increased for every name but one; NVDA VolDex fell following the release of earnings in a demonstration of the power of the volatility crush for single-name equities following earnings. Making money while being long volatility in the earnings and post-earnings market is very tough because of this crush, although the swings can be severe and short volatility strategies should have defined risk. That would include selling spreads and other multi-leg structures..
As we pointed out last week, TSLA had finally started showing a bit of put skew (RiskDex above 1.00). TSLA RiskDex closed the previous week at 1.01 and continued to rally this week.
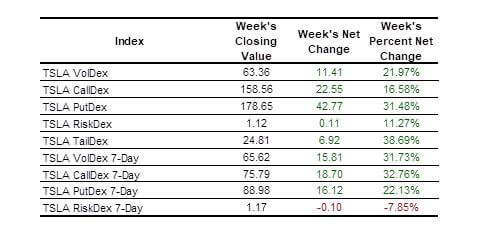

Why It Matters…VolDex values for the single names we cover have moved back into the middles of their recent ranges with MSFT VolDex and NVDA VolDex at their 40th percentiles. AAPL is at its 42nd percentile and TSLA at its 51st percentile.
That means traders can express their directional thesis using either long volatility or short volatility structures although we continue to urge traders to define their risk in short vol structures.
Scott’s Weekly Commentary:
We are in “risk off” mode even though the rally in option prices has been moderate. Treasury bond prices rallying, option prices rallying, stock prices falling, and bitcoin prices falling all signify market participants reining in their risk appetite. Who can blame them given the continued uncertainty regarding economic growth and efforts to massively shrink government in a compressed timeframe. We certainly have to cut government spending—deficits and federal debt levels demand it—and I’m sympathetic to the idea that the government is too large for cuts to be implemented with surgical precision. But the market would like a little more thought be given to the consequences for the economy and the potential unintended consequences for, well, everything.
Consumer confidence data was certainly disappointing but shouldn’t have been surprising. Inflation refuses to abate and the anecdotal stories about the cost of eggs are, well, easy to digest.
But it seems the larger risk to the market is no longer inflation, which would lead the Federal Reserve to hold off on the expected rate cuts, but is now growth, or lack thereof. I’ll be watching growth data very closely.
The largest names in the S&P 500 continue to struggle and eventually that will cause problems for the broad index if the struggle isn’t averted. The largest names in the S&P are: AAPL, NVDA, MSFT, AMZN, GOOG, and META. We calculate our Dexes on all of them so keep an eye on those values to divine market sentiment for these names.
Everyone at Nations Indexes hopes you have a healthy and profitable week.
Scott