
Your Week’s Volatility Market Commentary — Information Is Your Edge
The Weekly Takeaway:
- The S&P 500 rose by 1.59% to close at 6584.29. The index is now up 11.95% YTD;
- The Nasdaq-100 gained 1.86% this week as NVDA, TSLA, PLTR, and AVGO all gained more than 5%. The index is now up 14.66% YTD;
- VolDex (ticker VOLI) fell by 3.41% to close at 11.66. That is the 6th percentile of its 52-week range;
- TailDex (ticker TDEX) rose by 2.68%. This week’s close of 14.56 is the 14th percentile of its 52-week range;
- The overwhelmingly bullish sentiment was clear in S&P 500 CallDex and S&P 500 PutDex. CallDex rose by 25.89% while PutDex fell by 9.07%. CallDex closed at the 20th percentile of its 52-week range while PutDex closed at the 9th percentile;
- As a result, RiskDex fell by 29.11% to close at 3.01. The previous week’s close was the 45th percentile of the 52-week range while this week’s close was just the 19th percentile;
- The yield on the Treasury notes fell by 2.5 basis points and ended the week at just 4.061%. The market’s estimate of the likelihood of the Fed cutting the Fed Funds rate at the coming week’s meeting remains at 100%;
- Every volatility measure on Treasury bonds fell on the week as important catalysts that might impact the Fed’s decision have passed;
- Bitcoin volatility mimiced S&P 500 and Nasdaq-100 volatility this week as nearly all measures fell with the exception of CallDex which rallied;
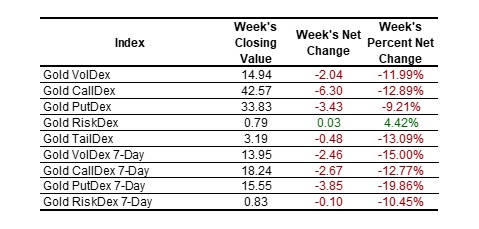
- Volatility in gold showed a strong downward bias this week;
- VolDex on the individual equity names we cover was again mostly higher this week. Only VolDex on NVDA fell significantly. Several names saw VolDex rally by more than 5%;
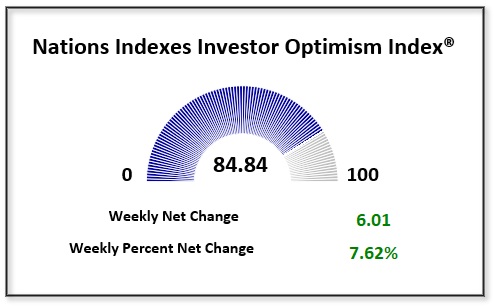
- The Nations Indexes Optimism Index® rose by 7.62% to close at 84.84.

Equity Index Volatility:
The price action in S&P 500 options this week was interesting with traders reaching to buy out-of-the-money call options in expectation of more upside.
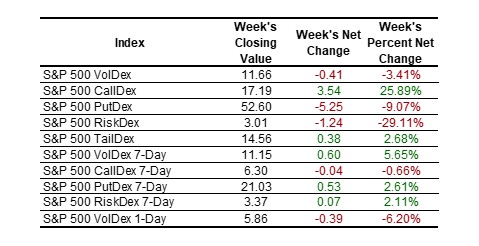
The collapse in S&P 500 RiskDex is noteworthy as it indicates opinions have pivoted from concerned to optimistic as RiskDex closed at 3.01. Its average close since 2005 is 3.75. These historical metrics (Average, median, 10th percentile, 25th percentile, 75th percentile, and 90th percentile) are available to subscribers at NationsIndexes.com.

Why It Matters…Historical data for all our indexes is available to subscribers at the Everything! level and they allow option traders to understand the context of the current option pricing environment – although the current environment, while not unique, is unusual. Volatility is mean-reverting and that is a phenomenon traders can take advantage of in both directions. But you have to understand what normal is, what the “mean” is, in order to do so.
Results for Nasdaq-100 volatility were similar to those for the S&P 500 with Nasdaq-100 volatility falling with the exception of CallDex which rose 20.11% to close at 24.26. That level is still just the 19th percentile of its 52-week range. This historical context is necessary in order to optimize option strategies.
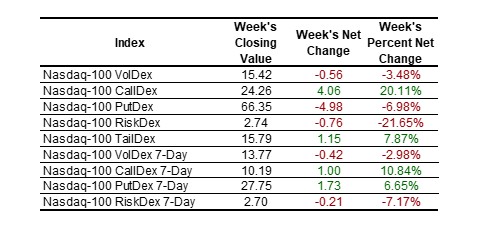

Nasdaq-100 RiskDex fell by 21.65% to close at 2.74 and is at the 50th percentile of its 52-week range signaling that tech investors are still worried about downside given this year’s gains and understandable concerns about stretched valuations.

Other Equity Indexes:
The Russell 2000 index of small capitalization stocks had been leading the way higher in previous weeks but fell behind the S&P 500 and Nasdaq-100, gaining just 0.25% this week as the biggest names grabbed the headlines. The moves in volatility on the Russell 2000 were similar to other equity indexes but more muted.
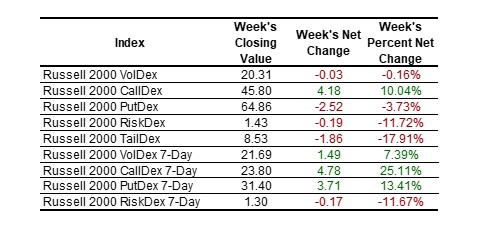
Why It Matters…Volatility measures for the equity indexes remain historically low despite stretched valuations and being in a period of the calendar which is often volatile. Our measures strongly urge avoiding any option structures which are short volatility.
Nations Investor Optimism Index:
The Investor Optimism Index rose by 7.62% to close at 84.84.
The index takes into account the current levels of S&P VolDex, TailDex, and RiskDex and compares them to their rolling 2-year ranges. It is plotted on a 0 to 100 scale.
Our Optimism Index is now available in real-time on our home page at NationsIndexes.com.
Other Asset Volatility:
Treasury Bonds and Notes:
The yield on 10-year treasury notes fell by another 2.5 basis points and closed at 4.061%. That is the lowest level since April when yields fell as low as 3.886% in response to tariff turmoil. Anything below 4.00% will be psychologically important.
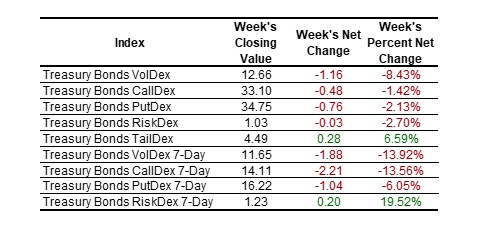
Treasury bond VolDex is still very low on an historical basis closing on Friday at 12.66 which is just the 7th percentile of its 52-week range.

Treasury bond CallDex and PutDex both fell as traders are certain the Fed is going to cut rates at the September 17 meeting. The closing RiskDex value of 1.03 suggests the market believes risks to the upside and downside are balanced.

Why It Matters…Treasury bond prices move inversely to interest rates and it is interesting that traders now believe the Fed cut is baked into the market and that risks following the rate cut are balanced. Interestingly, 7-Day RiskDex closed at 1.23 suggesting more fear to the downside over the very short term which now includes the Fed meeting.
Bitcoin:
Bitcoin volatility fell slightly and bullish sentiment returned.
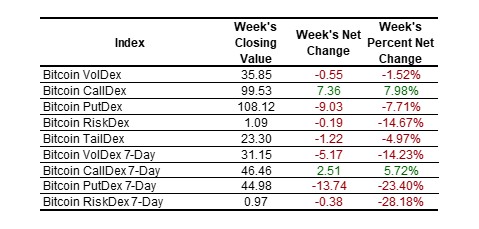
Last week we noted “The divergence in 7-day CallDex (up 17.45%) and 30-day CallDex (down 3.15%) is striking and we will continue watching.”
This week both measures rose so those who took advantage of the divergence likely did well.

Precious Metals:
Gold rose by another 1.11% as lower interest rates continue to help the shiny metal.

Option Window:
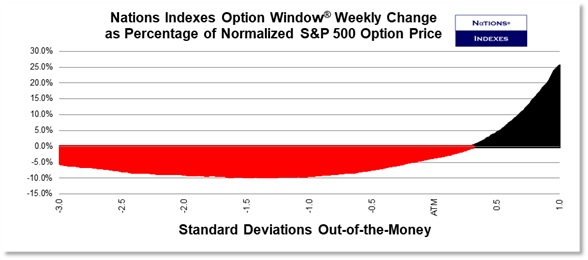
Option Window® is a graphical display of where S&P 500 option flows were concentrated this week. Any black areas show where buying drove prices higher at constant points of moneyness (horizontal axis) and time (constant 30 days to expiration) while red shows where selling drove option prices lower.
This week’s graphic reiterates the message sent by the index values. Selling predominated in most of the skew but option buyers were reaching above the level that is 0.4 standard deviations above at-the-money. That is approximately equal to the 6675 level.
0DTE and 1DTE Options:
Zero day to expiration (ODTE) options accounted for 59.5% of all SPY option volume this week.
0DTE volume on September 11 was just 51.7% of the total and on that day puts accounted for 62.6% of all SPY option volume.
Very short-dated volatility measures which use a variance swap methodology, as 1-day VIX does, inject significant error into the resulting measure because of the way out-of-the-money options trade in the hours before expiration. The VolDex at-the-money methodology is particularly suited for these very short-dated tenors.

Equities:
We have expanded the list of single names we cover to include not only the most dynamic stocks in the S&P 500 and the stocks with the highest option volume, but also the largest names in the S&P 500.
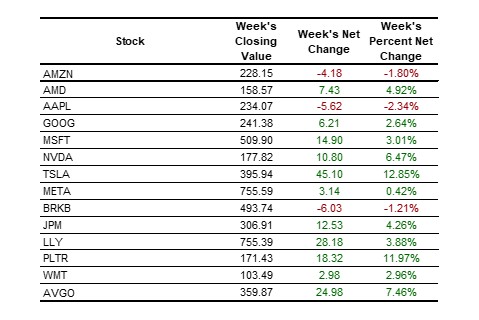
The single names we cover were generally higher this week.
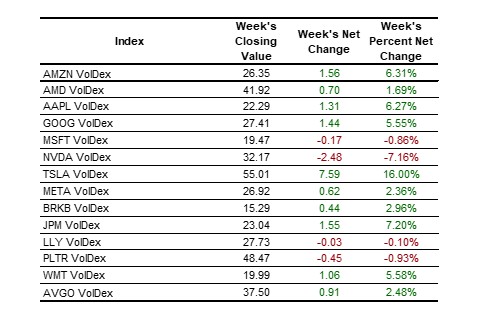
VolDex was also generally higher for the equities we cover. It is unusual for equities and volatility to rally simultaneously. It is possible that with stocks at all-time highs and many tech names very richly valued that investors have decided it is prudent to own some protection against price declines. This would serve to modulate any decline since some investors will be protected. This is an interesting dynamic we are focused on.
Last week we point out that “TSLA saw VolDex (at-the-money volatility) and CallDex (out-of-the-money call option volatility) increase while PutDex fell. This played out in both 30-day and 7-day tenors.”
These moves signaled this week’s 12.85% rally in TSLA shares.
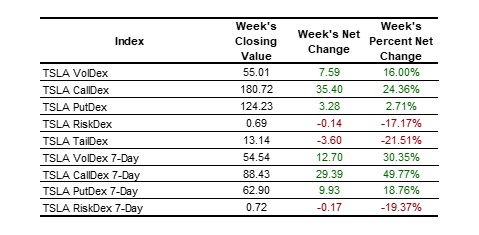
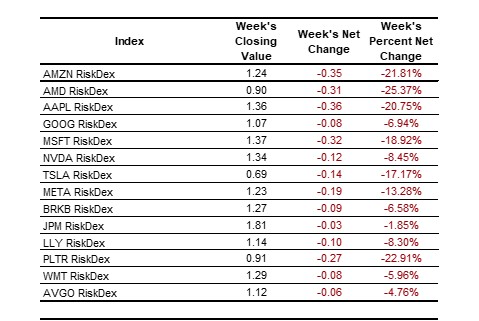
This week saw more of the same in TSLA volatility with VolDex gaining another 16.00% and CallDex gaining another 24.36% while PutDex gained just 2.71%. The result was that TSLA RiskDex fell by 17.17% to just 0.69 which is the 6th percentile of its 52-week range.

AAPL volatility measures were mixed on the week with VolDex gaining 6.27%.
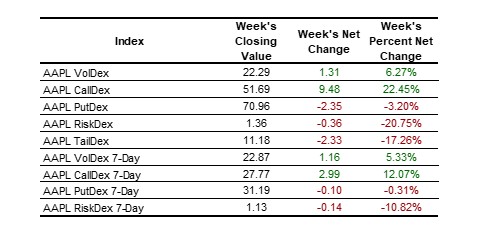
Last week we pointed out that AAPL was slightly overbought with an RSI on Friday’s close of 70.86 and that PutDex was cheap. We illustrated how many use our indexes by noting that “For example, in the October 3 expiry, buying the 225/235 put spread (buying the 235 put and selling the 225 put) could have been executed on Friday’s close at 2.00 with AAPL at 239.69. The spread costs just 20% of its width which is an attractive relationship for a spread so close to at-the-money in a stock that is slightly overbought. This is not a trade recommendation but is instead an example of how many traders use our indexes to generate specific trade ideas.”
This trade worked perfectly for those who chose to execute it and traders had tripled their money by Tuesday when we posted on X that anyone long those put spreads should take profits.
We will not make trade recommendations in this newsletter but will continue to post illustrations of how some traders use our indexes, particularly when momentum indicators suggest specific trade structures.
We’ll continue to comment during the week via our X account, @Nations_Indexes.
Scott’s Weekly Commentary:
Markets had another good week and and now seems they will continue higher until we have some exogenous event that leaves overextended investors looking for a chair because the music has stopped. But markets tend to go up over time and the timid investors who are always afraid of those unexpected events miss out on gains that are many times what they save by being out of the market when things are ugly. They sure seem prescient in the moment but they’re pretty quiet when the market is making highs.
That said, boy are these valuations worrisome. Tactical bearish bets or hedges, like the one we highlighted in AAPL last week as an illustration of how many use our indexes, make lots of sense with volatility and option prices so low despite being at a point in the calendar which used to stoke fear.
Trying to guess what the event will be, or when it will occur, is a worthless exercise. It may seem so obvious when it occurs or it may leave us searching for more information because we’ve never heard of the company/economy/geography involved, but it’s fruitless to try and guess what it will be. Better to prepare for the event than to guess what the event will be.
I think the important elements to think about now are to make certain you’re compensated for the market risk you’re taking. Companies being able to execute is just this sort of risk. The course of the broad economy is another. But company specific and idiosyncratic risk, particularly if it is geopolitical or geoeconomic in nature worries me. That’s what keeps me up at night right now.
Below you’ll see two graphics that we did not include in our regular narrative. The table of RiskDex values for the individual names we cover is particularly interesting. You’ll not that ALL of them declined this week in a signal that the market believes the market is more likely to rally than fall, at least versus last week’s numbers.
Everyone at Nations Indexes hopes you have a healthy and profitable week.
Scott