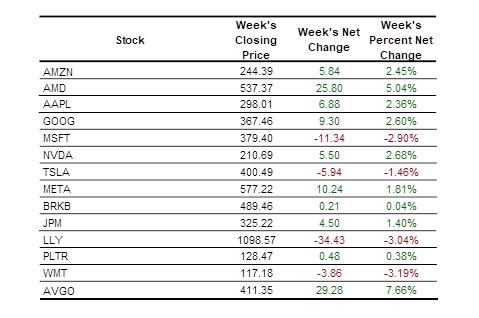
This week’s edition will be abbreviated due to the Juneteenth exchange holiday.
The Weekly Takeaway:
- The S&P 500 gained 0.93% this week as the U.S. and Iran signed a memorandum of understanding bringing their war to an end. The index is now up 9.57% for the year;
- The Nasdaq-100 gained 2.60% this week. It is now up 20.42% for the year;
- The yield on Treasury Notes fell by 3.6 basis points this week and closed at 4.451%;
- Crude oil futures fell by 10.35% this week as the agreement to end the war should reopen the Strait of Hormuz and allow Iran to resume selling crude oil into the international market;
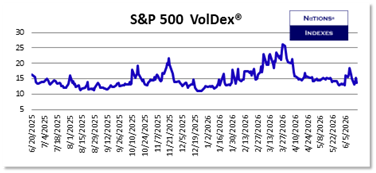
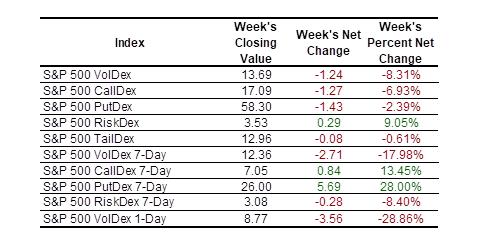
- S&P 500 VolDex (ticker VOLI) fell by 8.31% to close at 13.69. That is the 18th percentile of its 52-week range;
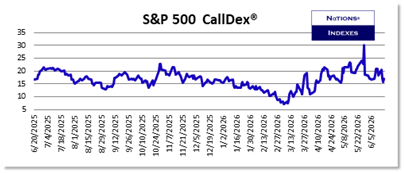
- Most 30-Day S&P 500 volatility measures fell; only RiskDex rose (+9.05%) as PutDex fell by less than CallDex. It is telling that CallDex fell by 6.93% despite the S&P having a good week and the war being brought to a conclusion. You can learn more about CallDex at Learn More About CallDex;
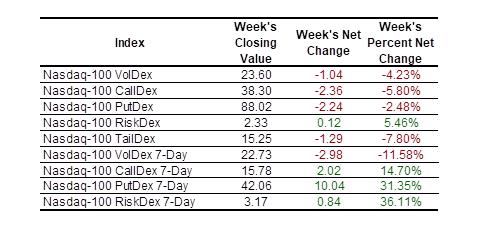
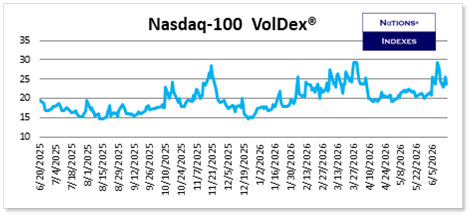
- VolDex on the Nasdaq-100 fell by 4.23% to close at 23.60 which is the 61st percentile of its 52-week range. S&P 500 VolDex and Nasdaq-100 VolDex are telling very different stories about the amount of volatility traders should expect in the respective indexes over the next 30 days;
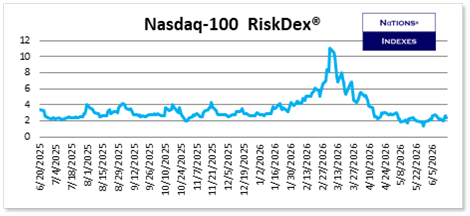
- Nasdaq-100 RiskDex was the only 30-Day Nasdaq-100 metric to rise as CallDex fell 5.80% but PutDex fell just 2.48%. You can see the details below;
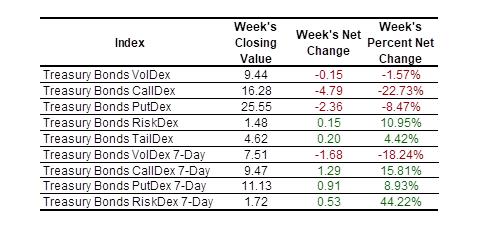
- Volatility in Treasury Bonds fell this week with Treasury Bond VolDex losing 1.57% and closing at just 9.44 which is the 5th percentile of its 52-week range. Some of this is due to the passage of the Fed meeting and traders expecting summer to bring less realized volatility in Treasury Bonds as is often the case;
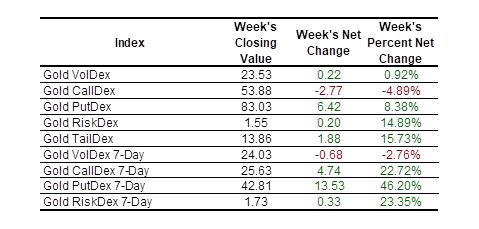
- Volatility in gold rose on the week with Gold VolDex gaining 0.92% and Gold PutDex gaining 8.38%;
- The individual equities we cover were mostly higher this week. AVGO was the big winner, gaining 7.66%. WMT was the big loser, falling 3.19%;
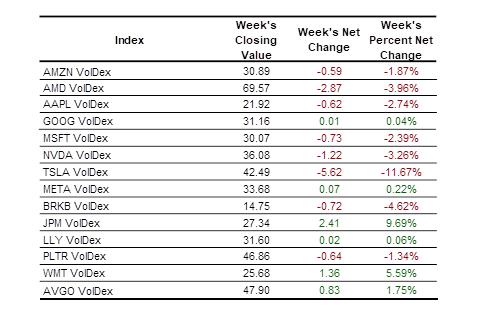
- SpaceX (SPCX) options began trading this week and volume was very high for a new issue. The expirys listed don’t yet allow for calculation of the complete suite of our indexes but we will make them available when we are able. SPCX VolDex closed at 110.43 on Tuesday, the first day of option trading, and closed on Thursday at 86.83;
- VolDex on other individual stocks was mixed as you can see below;
- You can always learn more about all our indexes at Learn More About Our Indexes.
Equity Index Volatility:
The S&P 500 gained 0.93% during the holiday-shortened week.
We would generally expect option prices to fall in front of a 3-day weekend and that happened in the S&P but it is interesting that CallDex fell nearly 7%. It is as if traders are throwing in the towel on upside in the S&P 500 over the next 30 days.
Historical metrics (Average, median, 10th percentile, 25th percentile, 75th percentile, and 90th percentile) for all our indexes are available to subscribers at NationsIndexes.com.
Why It Matters…Historical data for all our indexes is available to subscribers at the Everything! level and they allow option traders to understand the context of the current option pricing environment. You have to understand what normal is in order to do so.
As mentioned above, Nasdaq-100 VolDex fell by 4.23% but traders are expecting little realized volatility in the S&P 500 but substantial realized volatility in the Nasdaq-100 over the next 30 days.
You can learn more about VolDex at Learn More About VolDex.
Nasdaq-100 RiskDex rose by 5.46% but closed at just the 10th percentile of its 52-week range so while CallDex fell, traders still have a decidedly bullish bias for the Nasdaq-100.
You can learn more about RiskDex at Learn More About RiskDex.
Why It Matters…Traders have to have the objective data provided by our indexes to trade in a way that doesn’t rely on hunches or guesses.
Investor Optimism Index®:
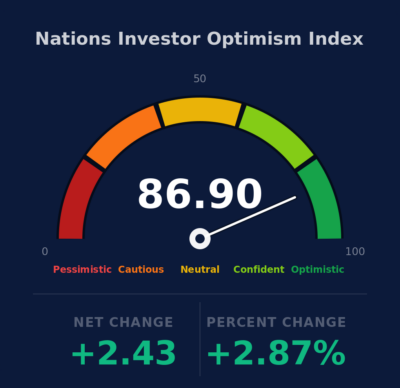
The Investor Optimism Index® rose by 2.87% to close at 86.90. Traders remain very optimistic regarding the next 30 days.
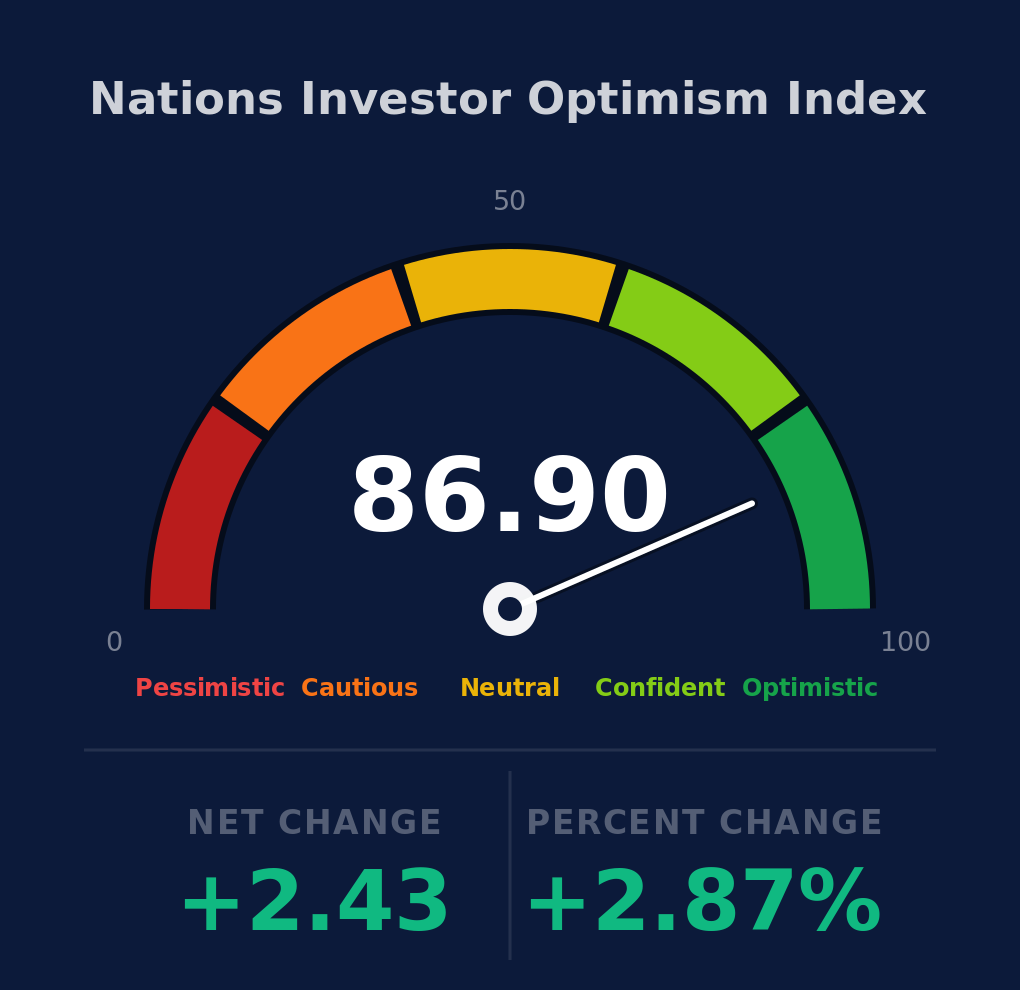
The index takes into account the current levels of S&P 500 VolDex, TailDex, and RiskDex and compares them to their rolling 2-year ranges. It is plotted on a 0 to 100 scale.
Our Optimism Index is now available in real-time on our home page at Nations Optimism Index.