The Weekly Takeaway:
- The S&P 500 gained 1.43% this week. That is 9 straight weeks of gains. The index is now up 10.73% for the year;
- The Nasdaq-100 gained 2.89% this week. The index is now up 20.13% for the year;
- Crude oil futures fell 8.78% to close at 87.78 as hopes for a reopening of the Strait of Hormuz and resolution to the war with Iran grew;
- The yield on Treasury Notes continued its retreat, falling 10.5 basis points. It closed this week at 4.453%. That decline helped equities;
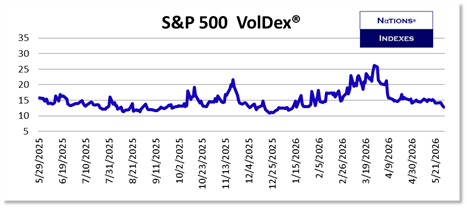
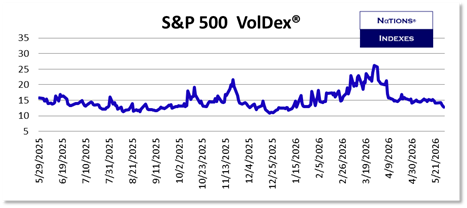
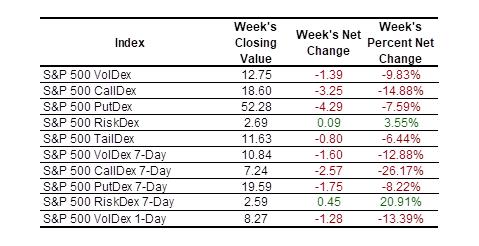
- S&P 500 VolDex (ticker VOLI) fell 9.83% to close at 12.75;
- Most S&P 500 volatility measures fell. Only RiskDex in both the 30-Day and 7-Day tenors rose because CallDex fell by more than PutDex. You can learn more about RiskDex at Learn More About RiskDex;
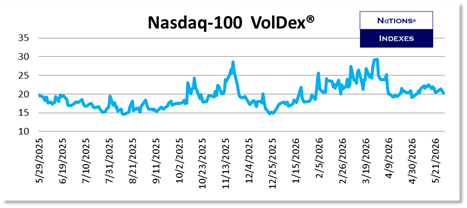
- VolDex on the Nasdaq-100 fell by 1.69% this week but remained above 20. This is a signal that traders expect realized volatility in the Nasdaq-100 to remain elevated relative to that in the S&P 500 over the next 30 days;
- Nasdaq-100 7-Day PutDex rose by 1.96% this week in another signal that traders recognize the potential for significant volatility in the Nasdaq-100;
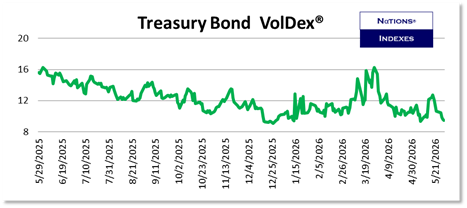
- Volatility in Treasury Bonds continued to ease this week as yields continued to fall. Treasury Bond VolDex fell by 10.85% and closed at just 9.49. Traders should use long positions in at-the-money options to express any directional thesis in treasuries;
- The individual equities we cover were mostly in the green this week. AMD once again gained more than 10% but PLTR was the big winner, gaining 14.36%;
- VolDex on individual stocks generally gained despite shares rising. This is a reflection of reasonable worry given the performance of these names year-to-date;
- You can always learn more about all our indexes at Learn More About Our Indexes.
Equity Index Volatility:
The S&P 500 gained 1.43% during the holiday-shortened week and closed higher every day. The index has gained for 9 straight weeks and is now up 10.73% for the year.
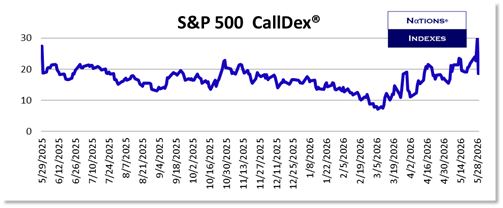
S&P 500 option prices eased as you can see below. It is interesting that CallDex fell by more than PutDex.
S&P 500 VolDex closed on Friday at just the 13th percentile of its 52-week range while Nasdaq-100 VolDex closed at 20.12, the 38th percentile of its 52-week range. Traders expect S&P 500 vol to ease as we get into summer but recognize that the trade in the Nasdaq-100 will be more treacherous.
S&P 500 CallDex fell by 14.88% which is noteworthy. Some traders clearly believe the S&P 500 will take a breather for the coming 30 days.
Historical metrics (Average, median, 10th percentile, 25th percentile, 75th percentile, and 90th percentile) for all our indexes are available to subscribers at NationsIndexes.com.
Why It Matters…Historical data for all our indexes is available to subscribers at the Everything! level and they allow option traders to understand the context of the current option pricing environment. You have to understand what normal is in order to do so.
As mentioned above, Nasdaq-100 VolDex fell by another 1.69% to close at 20.12. That is the 38th percentile of its 52-week range. The relative strength index for the Nasdaq-100 was 77.02 as of Friday’s close indicating that the index is overbought.
You can learn more about VolDex at Learn More About VolDex.
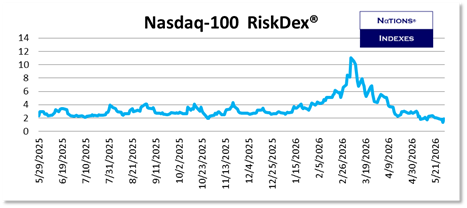
Despite the Nasdaq-100 being overbought and getting more overbought versus the previous week, Nasdaq-100 RiskDex fell by 7.85% and closed below 2.00. It is at just the 5th percentile of its 52-week range. We believe call-spread collars are interesting trade structures in QQQ options.
Why It Matters…Traders have to have the objective data provided by our indexes to trade in a way that doesn’t rely on hunches or guesses.
Term Structure:
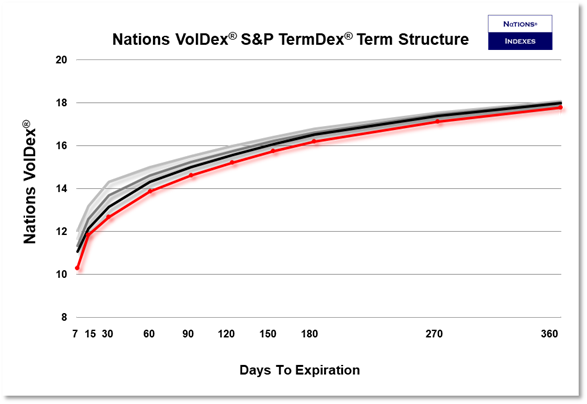
The Nations TermDex® measure of VolDex term structure illustrates S&P 500 VolDex for various tenors. It provides insight into both near-term and longer-term expectations for volatility in the S&P 500.
Term structure at the close on Friday (in red) remains sharply upward-sloping from left to right signaling very little concern for the near future. Any level below 10.00 would be very low, even during the typically-low summer.
1DTE Options:
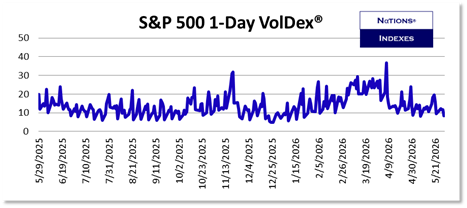
S&P 500 1-Day VolDex fell by 13.39% to close at 8.27.
Very short-dated volatility measures which use a variance swap methodology, as 1-day VIX does, inject significant error into the resulting measure because of the way out-of-the-money options trade in the hours before expiration. The VolDex at-the-money methodology is particularly suited for these very short-dated tenors.
Other Asset Volatility:
Treasury Bonds and Notes:
Bond and Note yields gave back a portion of recent increases for the second week. That allowed traders to sell vol although Treasury Bond VolDex below 10.00 signals that directional trades in Treasury Bonds should be expressed using long positions in at-the-money options and short vol structures should be avoided.
Precious Metals:
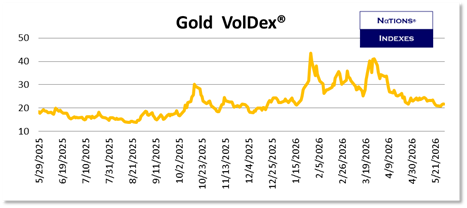
Gold rose 1.53% for the week and was helped by lower interest rates. Gold VolDex rose 3.24% to close at 21.79.
Equities:
We have expanded the list of single names we cover to include not only the most dynamic stocks in the S&P 500 and the stocks with the highest option volume, but also the largest names in the S&P 500.
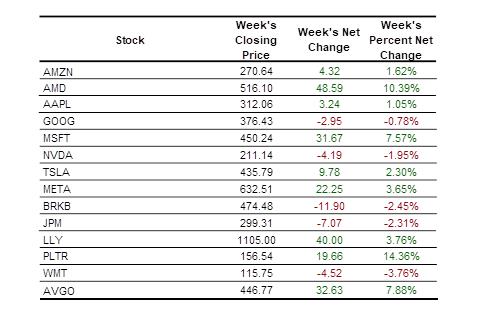
PLTR gained 14.36% this week while AMD gained another 10.39%. WMT was the big loser with a decline of 3.76%.
VolDex for these names was generally higher as traders recognize that volatility to the upside is still volatility and that it makes volatility to the downside more likely.
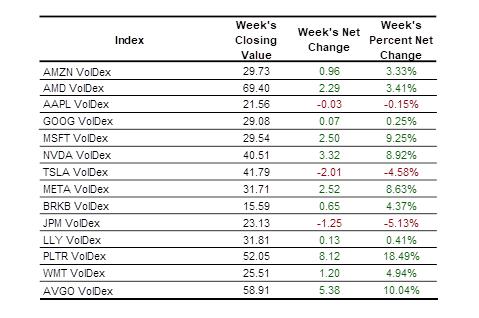
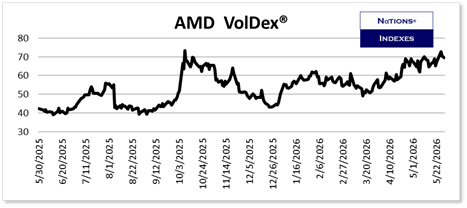
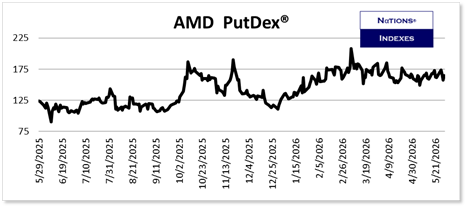
We discussed AMD vol last week and it managed to tick up again this week. AMD is overbought with an RSI reading of 75.98. AMD VolDex and PutDex both remain elevated as would be expected.
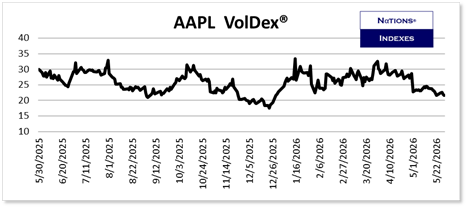
Interestingly, AAPL is even more overbought with an RSI reading of 78.77. Interestingly, AAPL VolDex is reasonably priced and is at the 25th percentile of its 52-week range while AAPL PutDex is at just the 13th percentile of its 52-week range. AAPL bears and hedgers should consider buying puts or put spreads in the iPhone maker.
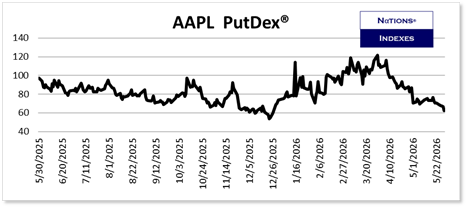
You can learn more about PutDex at Learn More About PutDex.
We’ll continue to comment during the week via our X account, @Nations_Indexes.
Scott’s Weekly Commentary:
Hopes for a deal with Iran pulled crude oil prices down 13.25% over the last 2 weeks and that has eased inflation fears. Rates are down as well and both have helped the stock market.
While hopes for AI businesses and their IPOs are driving much of the stock market, rates will be critically important so I’m paying attention even more than usual. Crude oil is still up 30% since the start of the war so I believe we’ll see higher prices through the rest of the year even if the war is resolved, and the Strait is reopened, before the end of June.
I’m struck by the horrible breadth in the S&P on Friday. While the broad index gained 0.22%, only 2 sectors gained ground (tech and financials) will the other 8 all lost ground with the Consumer Staples index falling 1.80% and the Consumer Discretionary index falling 0.97%. More than 300 constituents fell on the day while just 195 gained. I’m paying attention to this as well.
Finally, something quirky I’ve noticed. NVR, Inc. is a homebuilder headquartered in Virginia and it trades, not surprisingly, under the ticker NVR. What is surprising is its share price. NVR closed at 6104.80 a share on Friday. That’s right, NVR’s share price is more than two-times higher than the next highest stock price in the S&P 500 (AZO closed at 2935.19 on Friday). Why not split? It’s the Buffett philosophy that the high share price thwarts traders and encourages long-term investors. The company returns capital almost entirely through buybacks and just authorized a new $750 million buyback and that gooses the share price as well. It’s an interesting story and philosophy.
I hope you have a safe and profitable week.
Scott