Your Week’s Volatility Market Commentary — Make Information Your Edge
The Weekly Takeaway:
- The S&P 500 lost 0.35% this week. It is now up 1.02% for the year;
- The Nasdaq-100 gained 0.30% this week. It is now up 1.41% for the year;
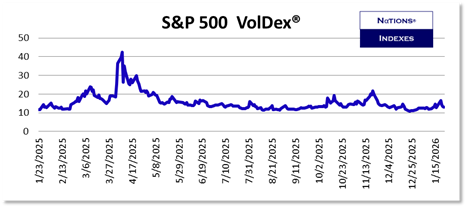
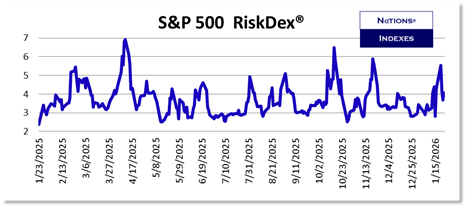
- S&P 500 VolDex (ticker VOLI) gained 1.89% this week and closed at 12.94. That is still just the 7th percentile of its 52-week range;
- S&P 500 TailDex (ticker TDEX) lost 7.35% this week after gaining 27.42% and 16.73% respectively in the previous two weeks. It closed at the 13th percentile of its 52-week range;
- S&P 500 RiskDex fell by 5.15% as CallDex rose more than PutDex. RiskDex remains above the important 4.00 level. You can learn more about RiskDex at Learn More About RiskDex;
- VolDex on the Nasdaq-100 rose by 0.56% this week to close at 17.87;
- CallDex on the Nasdaq-100 fell by 4.15% despite the Nasdaq-100 gaining slightly. This move suggests traders no longer expect a big rally in the Nasdaq-100 over the next 30 days. You can learn more about CallDex at Learn More About CallDex;
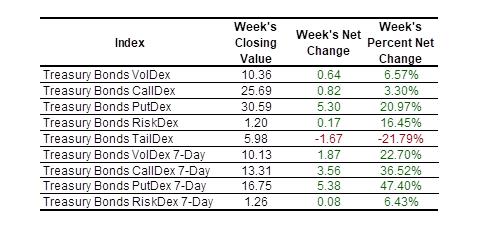
- The yield on Treasury Notes rose by another 0.8 basis points on the week to close at 4.239% after trading as high as 4.311% on Tuesday. That is the highest level since August. Every Treasury bond volatility metric rose on the week with the exception of TailDex;
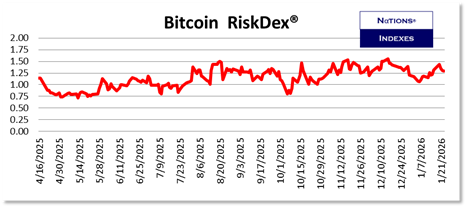
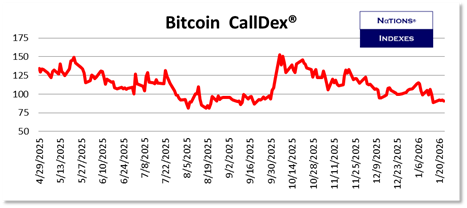
- Bitcoin fell 6.24% yet Bitcoin VolDex fell by 1.86% to 37.20. Strangely, CallDex rose while PutDex fell;
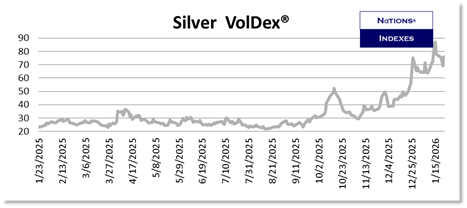
- Gold futures gained another 8.58% this week as Gold VolDex rose by 33.97% to close at 28.59. Silver rose by 15.47% and Silver VolDex fell by 2.35% to close at 75.92;
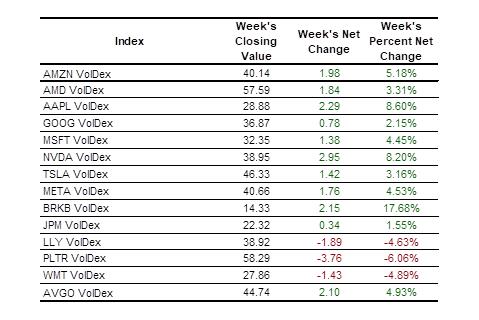
- VolDex for individual names was higher for every name with the exception of LLY (-4.63%), PLTR (-6.06%), and WMT (-4.89%);
- The Nations Indexes Optimism Index® rose by 2.03% to close at 79.08. Our Optimism Index is always available in real-time on our home page at NationsIndexes.com;
- You can always learn more about all our indexes at Learn More About Our Indexes;
Equity Index Volatility:
The S&P 500 lost just 0.35% for the week despite a loss of 2.06% on Tuesday in the face of fresh tariff concerns.
Every S&P 500 volatility metric was higher with the exception of RiskDex (-5.15% because CallDex rose more than PutDex) and TailDex which fell by 7.35% after gaining 48.74% in the previous 2 weeks.
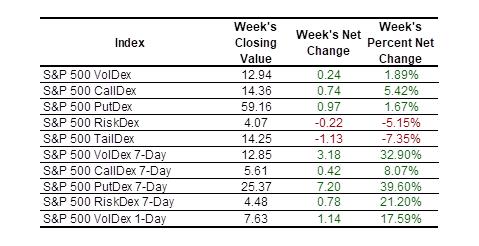
While RiskDex fell on the week it remained above the important 4.00 level and closed at the 37th percentile of its 52-week range. RiskDex says traders are worried that downside is more likely than upside for the S&P 500 over the next 30 days.
Historical metrics (Average, median, 10th percentile, 25th percentile, 75th percentile, and 90th percentile) for all out indexes are available to subscribers at NationsIndexes.com.
Why It Matters…Historical data for all our indexes is available to subscribers at the Everything! level and they allow option traders to understand the context of the current option pricing environment – the current environment, while not unique, is unusual. Volatility is mean-reverting and that is a phenomenon traders can take advantage of in both directions. But you have to understand what normal is, what the “mean” is, in order to do so.
The Nasdaq-100 gained 0.30% this week.
Nasdaq-100 volatility metrics were mixed as you can see below. The loss in CallDex is striking because it likely means traders are discounting the possibility of a rally in the Nasdaq-100 over the next 30 days. The gain in RiskDex signals that traders would rather buy Nasdaq-100 puts than Nasdaq-100 calls.
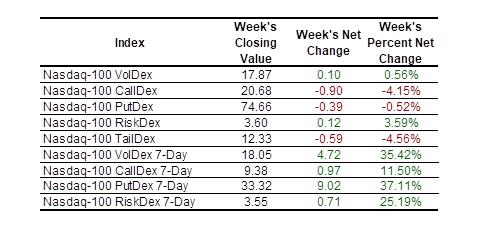
Nasdaq-100 VolDex is still at just the 10th percentile of its 52-week range.
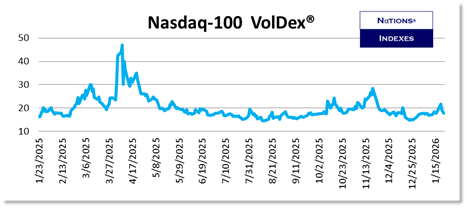
You can learn more about VolDex at Learn More About VolDex;
Nasdaq-100 RiskDex is now at the 61st percentile of its 52-week range, up from the 58th percentile last week. As we said last week: “The implication is that while option prices are low, traders are more pessimistic than optimistic for the Nasdaq-100 over the next 30 days.” This remains the case.
Why It Matters…Traders need to have the objective data provided by our indexes to trade in a way that doesn’t rely on hunches or guesses.
Nations Investor Optimism Index:
The Investor Optimism Index® rose by a modest 2.03% to close at 79.08.
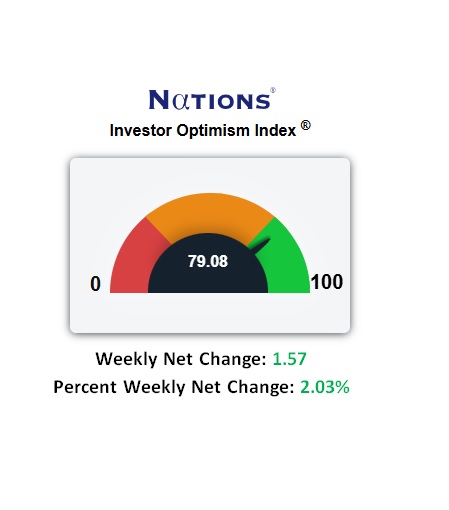
The index takes into account the current levels of S&P 500 VolDex, TailDex, and RiskDex and compares them to their rolling 2-year ranges. It is plotted on a 0 to 100 scale.
Our Optimism Index is now available in real-time on our home page at Nations Optimism Index.
1DTE Options:
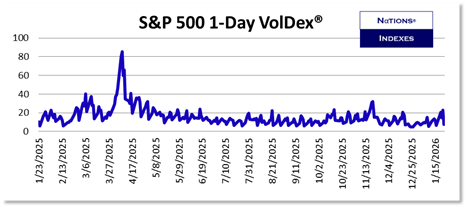
S&P 500 1-Day VolDex rose by 17.59%.
Very short-dated volatility indexes which use a variance swap methodology, as 1-day VIX does, inject significant error into the resulting measure because of the way out-of-the-money options trade in the hours before expiration. The VolDex at-the-money methodology is particularly suited for these very short-dated tenors.
Other Asset Volatility:
Treasury Bonds and Notes:
Treasury Bond volatility metrics were all higher with the exception of TailDex. But PutDex rallied by 20.97% so traders were buying just out-of-the-money Treasury bond puts as expressed by PutDex while selling deeply out-of-the-money puts as expressed by TailDex because it had rallied 70.77% last week. This signals that traders are worried about a moderate decline in Treasury bond prices but not a collapse.
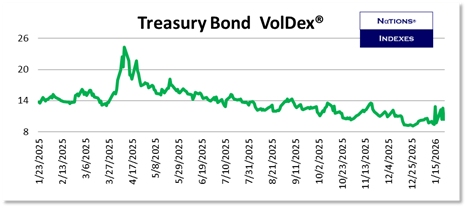
Treasury Bond VolDex closed above 10.00 but remains low. Directional trades in Treasury bonds can be expressed using long at-the-money vol structures. Short vol structures are still to be avoided.
Bitcoin:
Bitcoin fell by 6.24% on the week to close at 89,675 thanks to a decline of 6.11% on Tuesday.
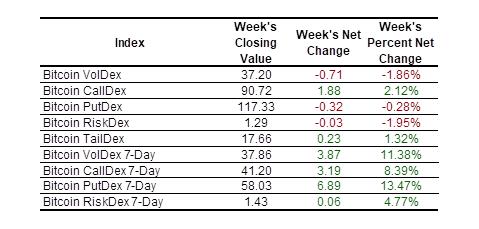
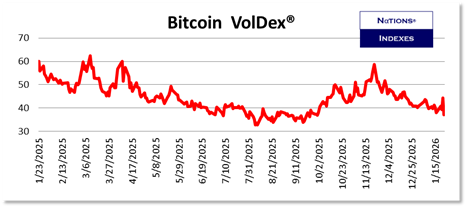
Bitcoin VolDex and PutDex fell despite the decline in bitcoin as CallDex rose. These option flows would suggest traders are using options to get long exposure to bitcoin when it is below 90,000.
You can learn more about CallDex at Learn More About CallDex;
The strike price represented by Bitcoin CallDex is approximately 100,250.
Precious Metals:
Silver rose by 15.47% after gaining 11.78% and 10.41% in the previous 2 weeks respectively.
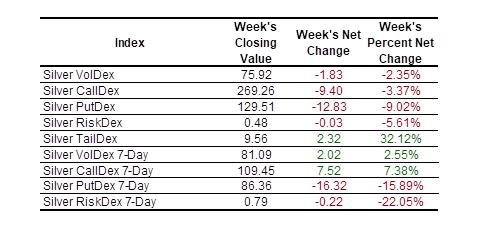
A Silver VolDex reading of 75.92 signals that traders expect daily moves in silver of 4.75% (Divide VolDex by 16 to turn the annual value into a daily value). But Silver VolDex fell by 2.35% this week suggesting that traders expect extraordinary volatility to continue but that options fairly reflect that.
Equities:
We have expanded the list of single names we cover to include not only the most dynamic stocks in the S&P 500 and the stocks with the highest option volume, but also the largest names in the S&P 500.
Equities were mixed this week with some names making big moves. AMD gained 12.01% this week while AVGO fell by 9.00%.
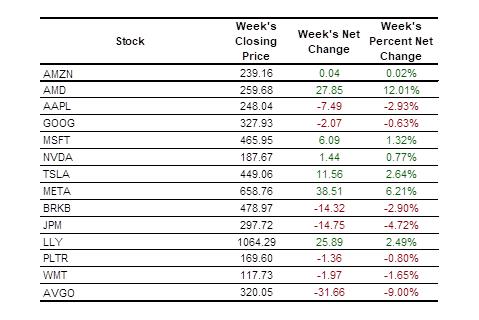
VolDex was less mixed with gains predominating for a third straight week.
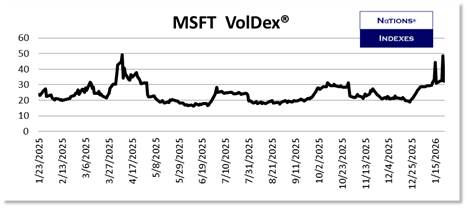
We note that MSFT VolDex gained 4.45% after gaining 5.69% for the previous week. It is now at the 49th percentile of its 52-week range.
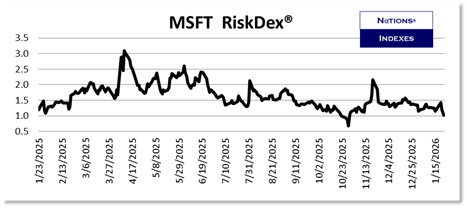
MSFT RiskDex closed at just 1.01 meaning CallDex and PutDex are nearly equal. This signals that traders weigh the likelihood of a rally as nearly equal to that for a break in the price of MSFT.
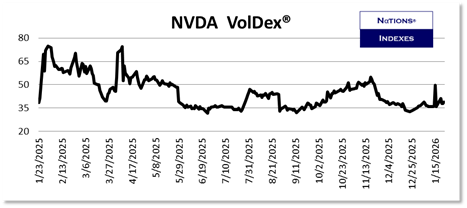
NVDA option prices are near the lows of their respective 52-week ranges. This is due in part to the fact that NVDA is set to report earnings on February 25 so our 30-Day metrics don’t fully capture that event yet. Watch for NVDA metrics to rally as that date approaches.
We’ll continue to comment during the week via our X account, @Nations_Indexes.
Scott’s Weekly Commentary:
Last week I kicked off my commentary with “I remain moderately bullish, mostly because short-term interest rates seem set to come down and long-term interest rates ticked up this week but only moderately so.”
I felt pretty stupid on Tuesday when renewed tariff turmoil drove the S&P down 2.06%. But the second part of that quote, the part about interest rates, meant that “dip buyers” reappeared and everyone else came back into the market as tariff fears evaporated.
We are so inured to drops in the stock market. That is generally good because the stock market rises over time even if it occasionally has some sickening episodes. But our vol indexes suggest there is less fear than there probably should be and while that is not necessarily bad, it worries me that if we have chaotic decline then investors will hold on and buy the dip and buy the dip and buy the dip until the market is down 20% from its top and only then will investors be overcome by horrible regret and bail out at the bottom. The problem is not the stock market – that goes up over time. The problem is always how we respond.
Everyone at Nations Indexes hopes you have a healthy and profitable week.
Scott