The Weekly Takeaway:
- The S&P 500 lost 1.95% this week and closed lower every day. It is now up 7.43% for the year;
- The Nasdaq-100 lost 4.24% this week and fell 4 of the 5 days (it gained 0.75% on Thursday). It is now up 15.32% for the year;
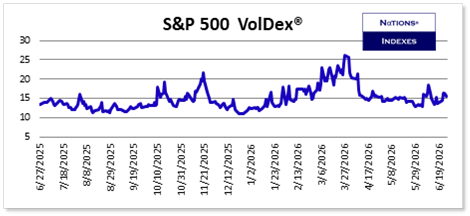
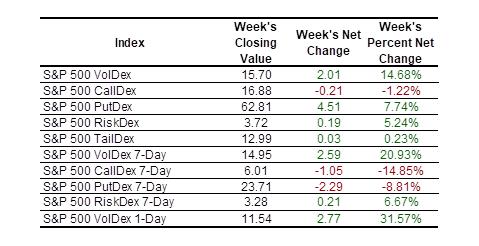
- S&P 500 VolDex (ticker VOLI) gained 14.68% to close at 15.70;
- The yield on Treasury Notes fell by 7.9 basis points to close at 4.372%;
- Crude oil futures fell by 8.14% this week thanks to the peace agreement reached with Iran. Crude closed at 69.42 on Friday;
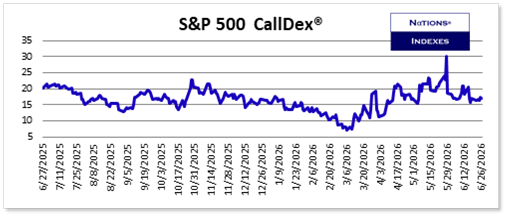
- Most S&P 500 volatility measures rose as the S&P 500 weakened. Only CallDex fell among the 30-Day measures as hopes for more upside over the next 30 days faded. You can learn more about CallDex at Learn More About CallDex;
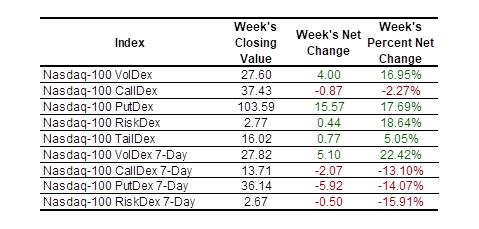
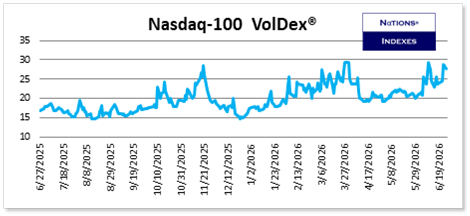
- VolDex on the Nasdaq-100 rose by 16.95% to close at 27.60 which is the 89th percentile of its 52-week range. Nasdaq-100 CallDex was the only Nasdaq-100 30-Day volatility metric to fall on the week, losing 2.27%;
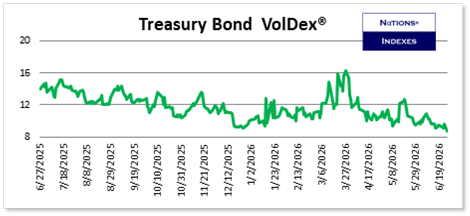
- Volatility in Treasury Bonds fell again this week as bond prices continued to recover with Treasury Bond VolDex losing 8.02% and closing at 8.68 which is the bottom of its 52-week range;
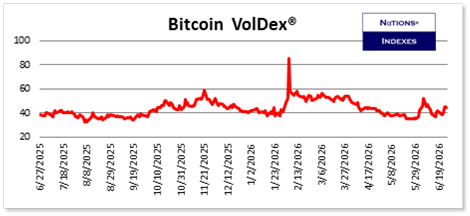
- Bitcoin fell by 5.11% this week and while Bitcoin VolDex rose 5.88% to close at 44.57, it is still at just the 22nd percentile of its 52-week range;
- The individual equities we cover were mostly lower with only BRKB, JPM, and LLY gaining ground;
- VolDex on individual stocks was generally higher with several names showing increases of more than 10%;
- You can always learn more about all our indexes at Learn More About Our Indexes.
Equity Index Volatility:
The S&P 500 lost ground every day this week including a loss of 1.44% on Tuesday.
S&P 500 option prices generally rose as you can see below. It is worth noting that traders rushed in to buy out-of-the-money calls last week but lost some interest in owning upside this week.
S&P 500 VolDex closed on Friday at the 30th percentile of its 52-week range. CallDex closed at the 42nd percentile of its 52-week range while PutDex closed at the 24th percentile of its range so traders are still favoring out-of-the-money calls to some degree despite this week’s loss.
Historical metrics (Average, median, 10th percentile, 25th percentile, 75th percentile, and 90th percentile) for all our indexes are available to subscribers at NationsIndexes.com.
Why It Matters…Historical data for all our indexes is available to subscribers at the Everything! level and they allow option traders to understand the context of the current option pricing environment. You have to understand what normal is in order to do so.
As mentioned above, Nasdaq-100 VolDex rose by 16.95%. That is the 89th percentile of its 52-week range so the vol regimes for the S&P 500 and Nasdaq-100 remain very different.
You can learn more about VolDex at Learn More About VolDex.
Nasdaq-100 CallDex fell 2.27% for the week and closed at the 59th percentile of its 52-week range while PutDex rose by 17.69% and closed at the 66th percentile of its range in another divergence from S&P 500 volatility.
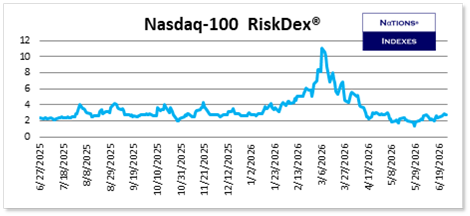
Nasdaq-100 RiskDex rose by 18.64% but it still closed at just the 14th percentile of its 52-week range.
You can learn more about RiskDex at Learn More About RiskDex.
Why It Matters…Traders have to have the objective data provided by our indexes to trade in a way that doesn’t rely on hunches or guesses.
Investor Optimism Index®:
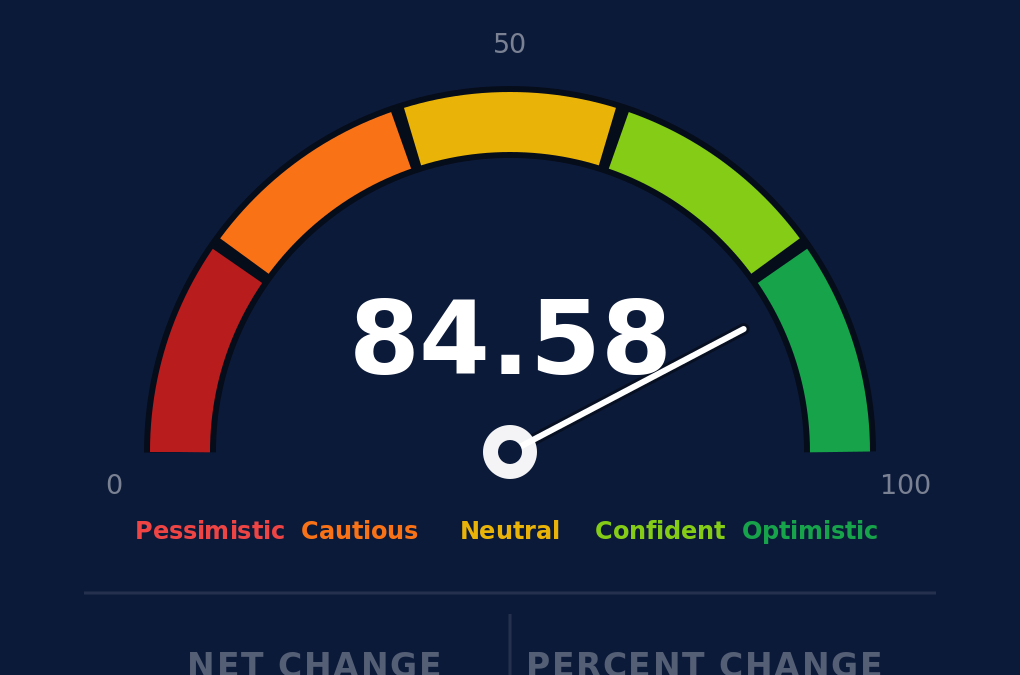
The Investor Optimism Index® fell by 2.68% to close at 84.58. Traders remain very optimistic regarding the next 30 days despite the week’s disappointing price action.
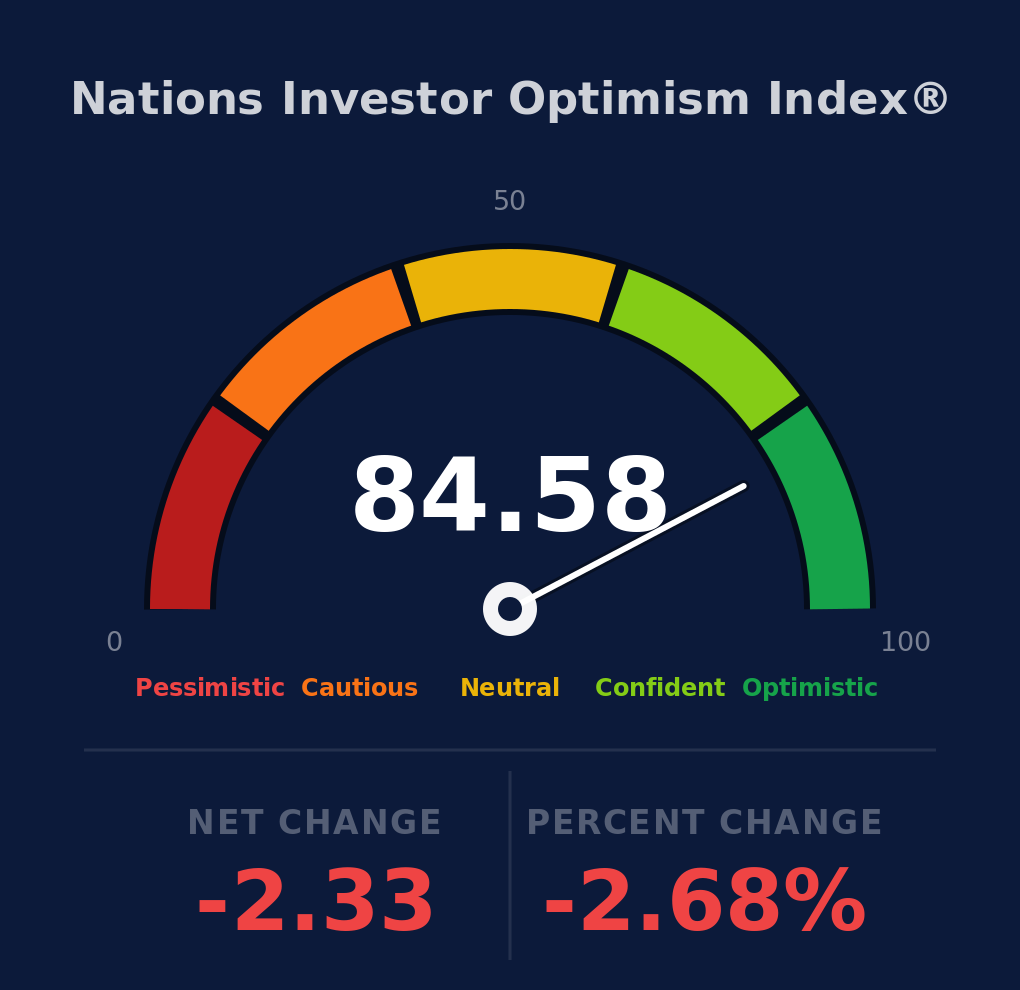
The index takes into account the current levels of S&P 500 VolDex, TailDex, and RiskDex and compares them to their rolling 2-year ranges. It is plotted on a 0 to 100 scale.
Our Optimism Index is now available in real-time on our home page at Nations Optimism Index.
TermDex® VolDex Term Structure:
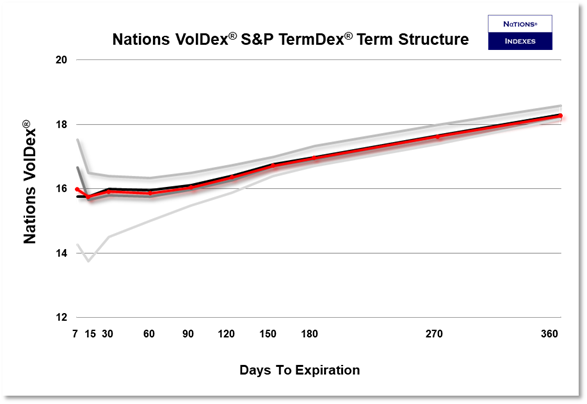
The Nations TermDex® measure of VolDex term structure illustrates S&P 500 VolDex for various tenors. It provides insight into both near-term and longer-term expectations for volatility in the S&P 500.
Term structure at the close on Friday (in red) was little changed and showed little movement during the week. It remains upward sloping but is relatively flat.
0DTE and 1DTE Options:
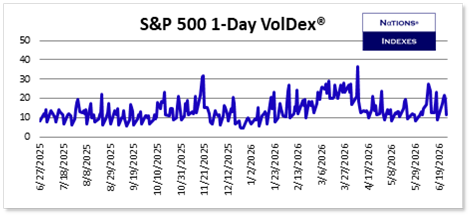
S&P 500 1-Day VolDex rose by 31.57% for the week as traders worry about status in Iran, which proved to be prescient, along with concerns that investors might review markets and holdings over the weekend and decide to sell some equities on Monday.
Very short-dated volatility measures which use a variance swap methodology, as 1-day VIX does, inject significant error into the resulting measure because of the way out-of-the-money options trade in the hours before expiration. The VolDex at-the-money methodology is particularly suited for these very short-dated tenors.
Other Asset Volatility:
Treasury Bonds and Notes:
Bond and Note yields fell back slightly so volatility again fell in unison. Treasury Bond VolDex fell by 8.02%. Treasury Bond volatility is seasonally low during the summer months but we remain convinced that, at these prices, directional trades in Treasury Bonds should be executed using long positions in at-the-money options.
Precious Metals:
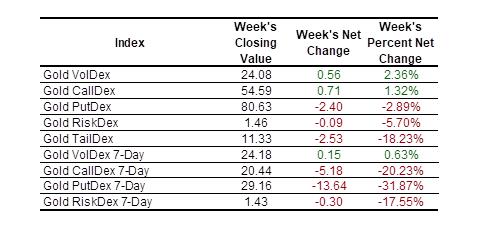
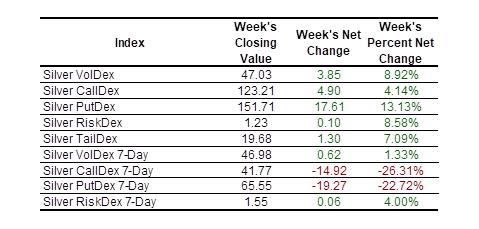
Gold fell again this week, losing another 3.67% to end the week at 4,081. It traded blow 4,000 on Wednesday, Thursday, and Friday. Silver fell 10.53% for the week and closed at 59.03. Despite this, Gold PutDex fell slightly on the week.
Bitcoin:
Bitcoin resumed its slide and lost 5.11% for the week while closing below 60,000. Bitcoin VolDex closed at 44.57. We have often noted traders’ willingness to short Bitcoin VolDex when it is above 50 and we will continue to watch that level.
Equities:
We have expanded the list of single names we cover to include not only the most dynamic stocks in the S&P 500 and the stocks with the highest option volume, but also the largest names in the S&P 500.
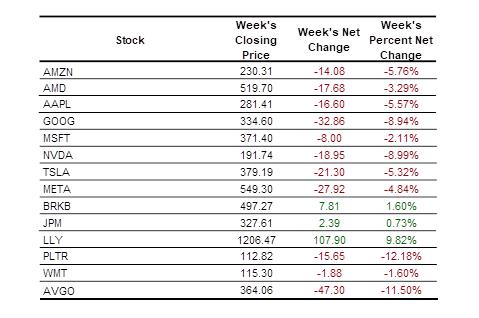
Tech and AI names lost ground despite blowout earnings from Micron.
VolDex was higher for all the names we cover with the exception of “old economy” stalwarts WMT and JPM. Earnings release dates will start to factor into the volatility picture for tech names.
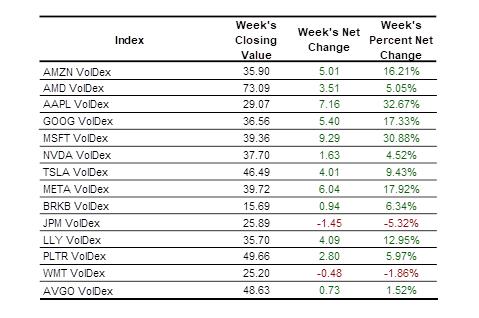
Despite this week’s price action and ongoing concerns, RiskDex for several tech names ended the week below 1.00 meaning out-of-the-money calls are more expensive than out-of-the-money puts. That means holders of names with RiskDex readings below 1.00 can put on attractive risk reversal hedges (short a covered call and long a protective put) and speculators can executive bearish call-spread risk reversals at attractive prices.
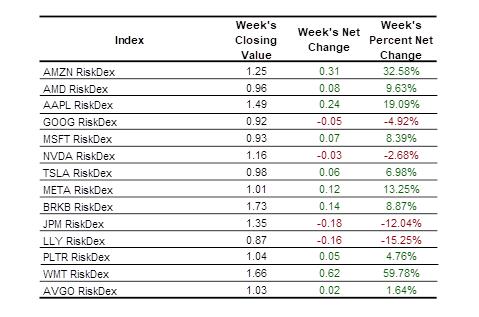
You can learn more about RiskDex at Learn More About RiskDex.
We’ll continue to comment during the week via our X account, @Nations_Indexes.
Scott’s Weekly Commentary:
Micron’s blowout earnings should have been great news for the stock market but other tech names sold off in response – while memory chip makers are doing great with massive pricing power, the market realizes that other tech names will have to pay those prices. AAPL was an example as shares fell 5.57% on the news that they would raise prices on several products to account for higher prices they have to pay for memory chips. I also think the SpaceX IPO has sucked up a lot of liquidity.
The U.S. military responded on Friday to Iran’s attack on a merchant ship but the action wasn’t announced until after the market had closed. I’ll be watching equity and crude oil futures on Sunday night but this is why said on CNBC Asia on Thursday evening that I believe markets are too optimistic regarding equity prices but particularly regarding crude oil prices which were up just 4.4% since the start of the war as of Friday’s close.
I hope you have a safe and profitable week.
Scott