Our Indexes

The world's leading
independent volatility indexes.

Five precision-engineered indexes that strip away the distortions of legacy vol measures — giving you a clean, real-time read on what options are actually pricing.

📊
VolDex®
A better way to measure option volatility
VolDex® focuses on the options that matter most—at-the-money (ATM) options with near-term expirations—giving a cleaner, more accurate view of implied volatility.

By isolating these highly liquid and actively traded contracts, VolDex avoids the distortion caused by less relevant, far out-of-the-money options. The result is a more precise snapshot of market expectations for price movement and investor sentiment—without the noise.
Explore VolDex®
📈
CallDex®
A clearer signal of bullish sentiment & expected volatility
CallDex® tracks the cost of out-of-the-money call options to gauge market sentiment for the next 30 days. It uses call options that are one standard deviation out-of-the-money to measure what investors are expecting in terms of both volatility and potential price direction.

Higher CallDex values generally suggest traders are anticipating bigger moves or a possible market rally. Lower values indicate a calmer outlook or reduced interest in upside exposure.
Explore CallDex®
📉
PutDex®
Focused on downside risk pricing
PutDex® delivers a clear, strike-specific measure of implied volatility by concentrating on one key data point: the normalized cost of a 30-day, one standard deviation out-of-the-money (OTM) SPY put option.

This approach isolates the segment of the options market most directly associated with downside protection, removing the noise from less relevant strike prices. The result precisely indicates market sentiment around tail risk, hedging activity, and bearish positioning.

By zeroing in on these put options—widely used by institutional investors to protect against market declines—PutDex offers valuable insight into how much investors are willing to pay to insure against losses over the next month.
Explore PutDex®
⚖️
RiskDex®
A Clear Signal of Expected Market Direction
RiskDex® measures investor sentiment by comparing the normalized cost of 30-day, one standard deviation out-of-the-money (OTM) SPY put and call options. This simple ratio reveals whether the market is more focused on downside protection or upside opportunity — offering a direct view of expected equity direction over the next month.

Unlike traditional volatility indexes, which reflect overall price movement, RiskDex highlights directional bias. A rising RiskDex indicates OTM put prices are increasing at a faster rate than OTM call prices and suggests growing concerns about potential declines; a lower reading signals confidence or complacency.

This makes RiskDex a valuable tool for traders and risk managers seeking clarity on where the market thinks it's headed—not just how volatile it might be.
Explore RiskDex®
🦅
TailDex®
A smarter signal for downside risk & tail hedging demand
TailDex® measures the price of deep out-of-the-money put options to assess bearish sentiment and demand for tail risk protection over the next 30 days. By focusing on puts that are three standard deviations OTM, it reflects how concerned traders are about a major downside move, often called a 'tail event'.

Higher TailDex values suggest rising demand for crash protection or increased fear of large selloffs. Lower values imply a calmer market tone and less urgency to hedge against tail risk.
Explore TailDex®

SP VolDex 1-11-2025

Your Week’s Volatility Market Commentary — Make Information Your Edge

This Week’s Edition Is Abbreviated Due To the Holiday.

The Weekly Takeaway:

  • The S&P 500 gained 1.40% during the holiday-shortened week. It is now up 17.82% for the year;
  • The Nasdaq-100 gained 1.18% this week. The index is now up 22.05% for the year;
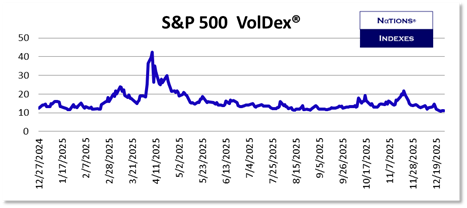
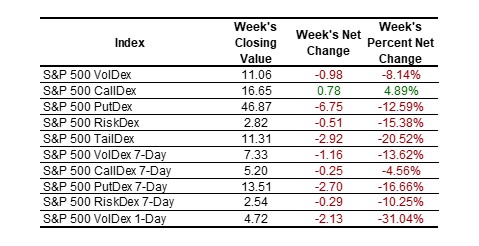
  • S&P 500 VolDex (ticker VOLI) closed at 11.06, a decline of 8.14% for the week. You can learn more about VolDex at Learn More About VolDex;
  • S&P 500 TailDex (ticker TDEX) closed at 11.31, a loss of 20.52% for the week. Important historical metrics for all our indexes including average, median, and critical percentile closes are available to subscribers at NationsIndexes.com;
  • S&P 500 CallDex rose by 4.89% this week to close at 15.65. CallDex is the only S&P 500 volatility metric which rose on the week;
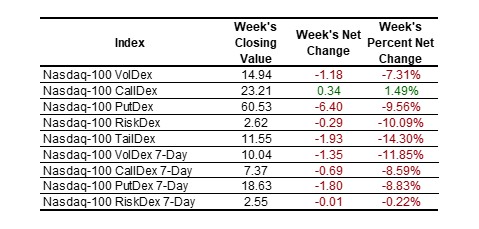
  • VolDex on the Nasdaq-100 fell by 7.31% to close at 14.94. CallDex on the Nasdaq-100 is the only Nasdaq-100 volatility metric to rise on the week;
  • This time of year has historically posted very low volatility metrics. Traders should recognize that but might also take advantage since the first 3 weeks of the new year may show substantial volatility;
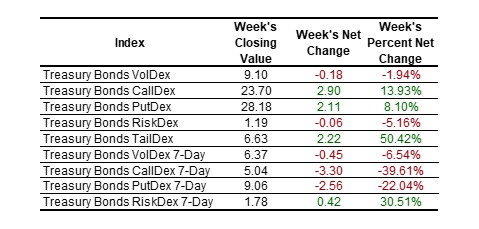
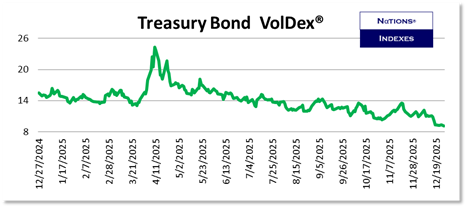
  • The yield on 10-year Treasury Notes fell by 1.5 basis points to 4.136%. Treasury Bond VolDex fell another 1.94% to close at just 9.10;
  • Bitcoin gained 0.02% this week and Bitcoin VolDex fell by 8.89% to close at 40.91. Every volatility metric in Bitcoin fell on the week;
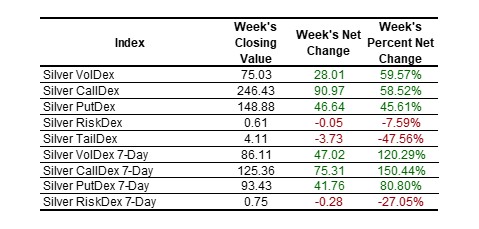
  • Silver gained 16.89% this week. Volatility metrics for silver exploded this week with VolDex gaining 59.57% and CallDex gaining 58.52%;
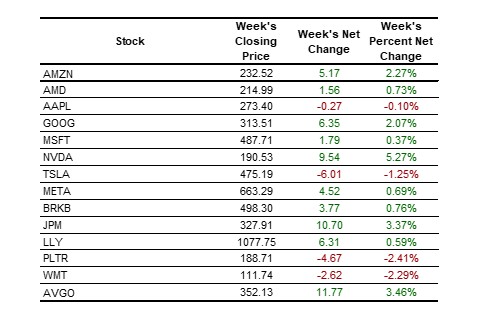
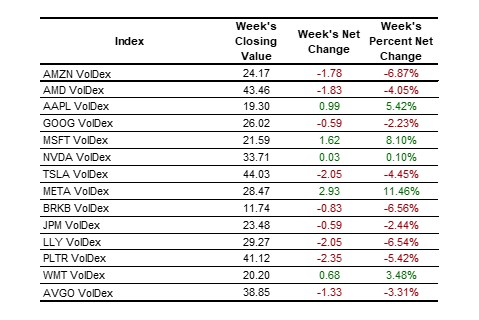
  • VolDex for individual names was generally lower in sympathy with the broad market although VolDex on AAPL, MSFT, and META jumped;
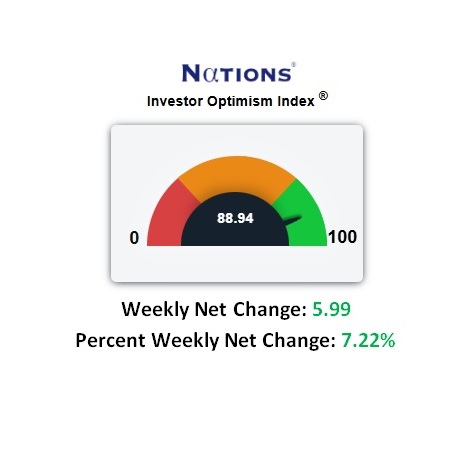
  • The Nations Indexes Optimism Index® rose by 7.22% to close at 88.94 which expresses substantial optimism although this should be tempered by recognizing the seasonal aspect to the volatility inputs. Our Optimism Index is always available in real-time on our home page at NationsIndexes.com;
  • You can always learn more about all our indexes at Learn More About Our Indexes;

SP VolDex 1-11-2025

SP VolDex 1-11-2025

SP VolDex 1-11-2025

SP VolDex 1-11-2025

SP VolDex 1-11-2025

SP VolDex 1-11-2025

SP VolDex 1-11-2025

SP VolDex 1-11-2025

SP VolDex 1-11-2025