The Weekly Takeaway:
- The S&P 500 lost 0.61% this week. It is up 8.28% for the year to date;
- The Nasdaq-100 lost 1.62% this week. It is up 11.40% for the year to date;
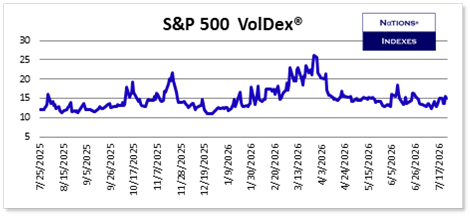
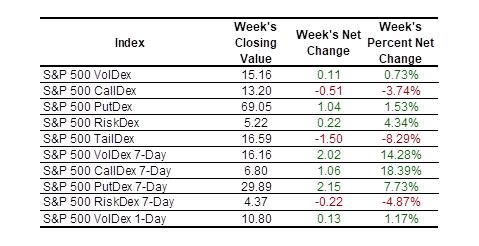
- S&P 500 VolDex (ticker VOLI) rose 0.73% this week to close at 15.16. That is the 27th percentile of its 52-week range;
- The yield on Treasury Notes rose by 13.8 basis points this week and made a new 52-week high of 4.714% on Thursday before ending the week at 4.679%;
- Crude oil futures gained 10.55% this week after gaining 13.90% in the previous week to close at 90.11;
- S&P 500 volatility measures were mixed this week with CallDex falling for the second straight week as traders sold calls to get short the falling market. TailDex also fell as concerns for a “tail event” ebbed. You can learn more about CallDex at Learn More About CallDex;
- VolDex on the Nasdaq-100 fell by 0.25% to close at 25.95 which is the 78th percentile of its 52-week range. The divergence between VolDex for the S&P 500 and for the Nasdaq-100 is narrowing but very slowly;
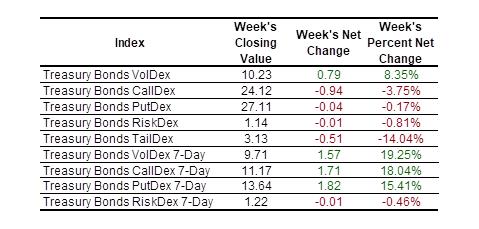
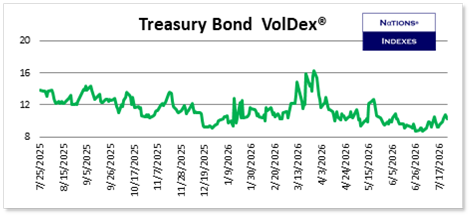
- VolDex for Treasury Bonds rose by 8.35% and regained the 10 level, closing at 10.23. That is just the 20th percentile of its 52-week range;
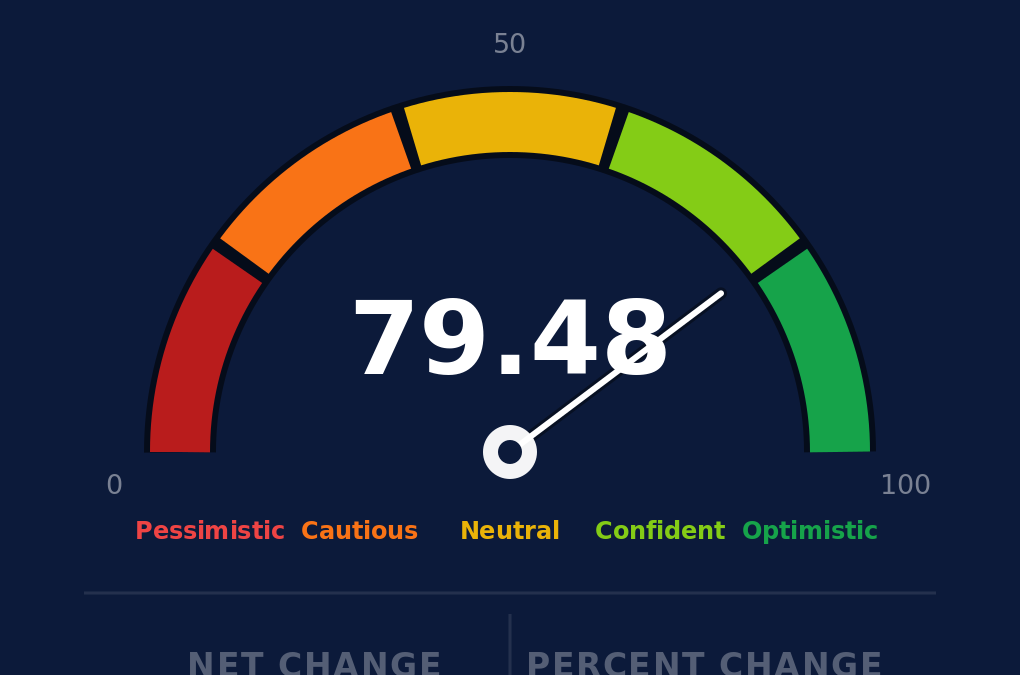
- The Nations Optimism Index® fell by 0.07% and closed at 79.48 which is still very confident;
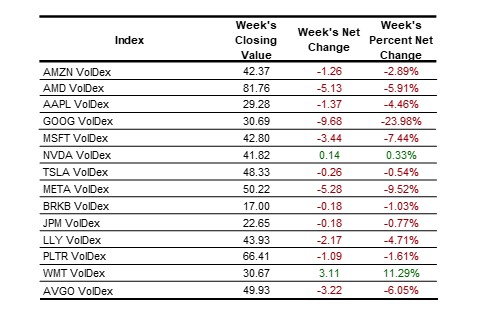
- VolDex on individual stocks we follow was generally lower as the worst fears from last week eased a bit;
- You can always learn more about all our indexes at Learn More About Our Indexes.
Equity Index Volatility:
The S&P 500 lost 0.61% for the week due to the loss of 1.21% on Thursday.
S&P 500 option prices generally rose although CallDex fell as traders sold out-of-the-money calls to get short exposure to the index. Surprisingly, TailDex also fell, losing 8.29% and closing at 16.59 which is just the 33rd percentile of its 52-week range.
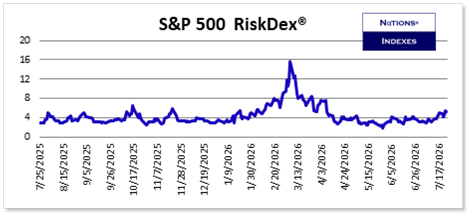
RiskDex rose another 4.34% after last week’s 62.01% rally and closed at 5.22 which is historically very high and shows substantial put skew.
Traders have to have this kind of insight to understand what the option market is saying and to craft the best possible trade structures. You can learn more about RiskDex at Learn More About RiskDex;
Historical metrics (Average, median, 10th percentile, 25th percentile, 75th percentile, and 90th percentile) for all our indexes are available to subscribers at NationsIndexes.com.
Why It Matters…Historical data for all our indexes is available to subscribers at the Everything! level and they allow option traders to understand the context of the current option pricing environment. You have to understand what normal is in order to do so.
As mentioned above, Nasdaq-100 VolDex fell by 0.25% but remains at the 78th percentile of its 52-week range and is below the peak hit in both June and March of this year.
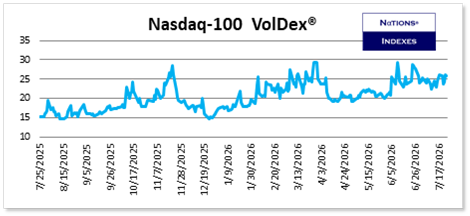
You can learn more about VolDex at Learn More About VolDex.
Most Nasdaq-100 volatility measures fell on the week as last week’s scramble to buy volatility eased somewhat.
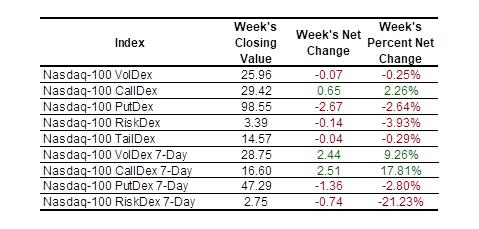
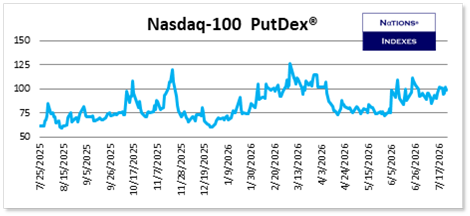
You can learn more about PutDex at Learn More About PutDex.
Why It Matters…Traders have to have the objective data provided by our indexes to trade in a way that doesn’t rely on hunches or guesses.
Investor Optimism Index®:
The Investor Optimism Index® fell by 0.07% to close at 79.48 meaning traders remain confident regarding the next 30 days despite this week’s price action.
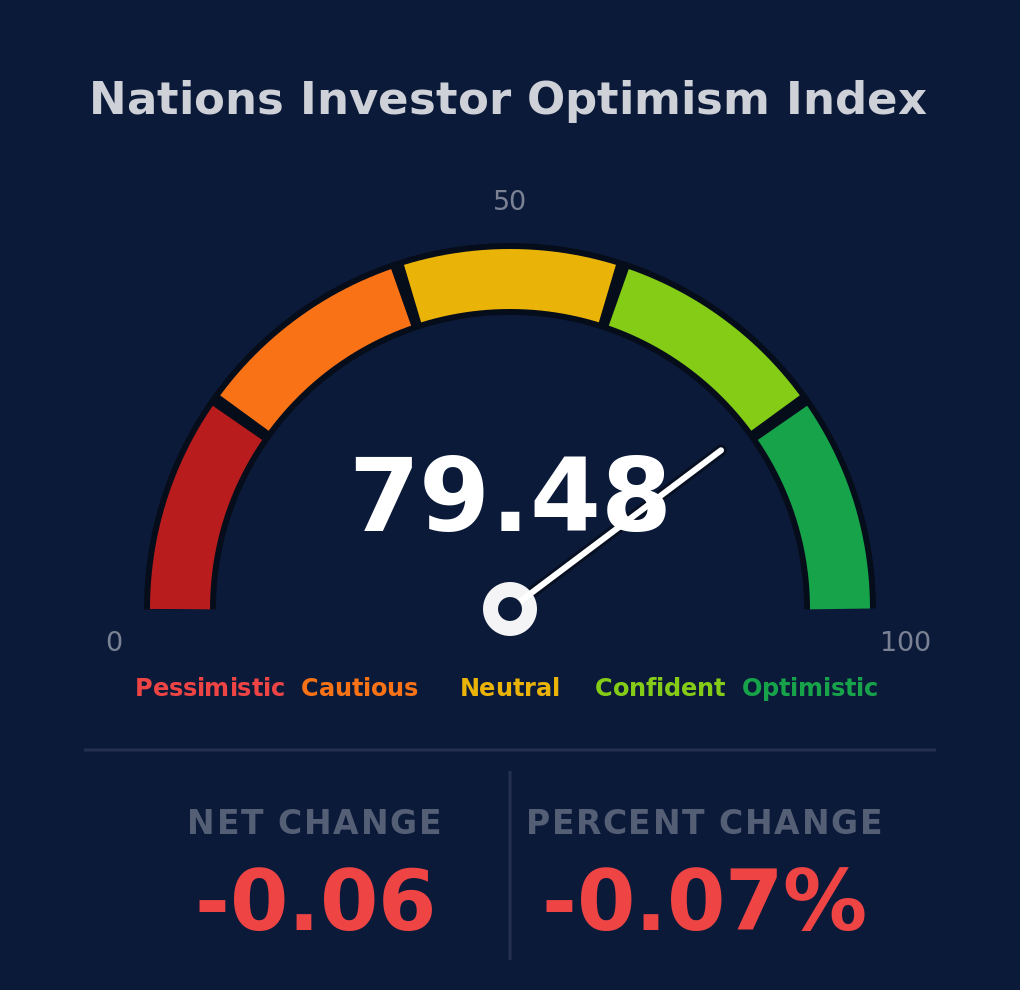
The index takes into account the current levels of S&P 500 VolDex, TailDex, and RiskDex and compares them to their rolling 2-year ranges. It is plotted on a 0 to 100 scale.
Our Optimism Index is now available in real-time on our home page at Nations Optimism Index.
Option Window®:
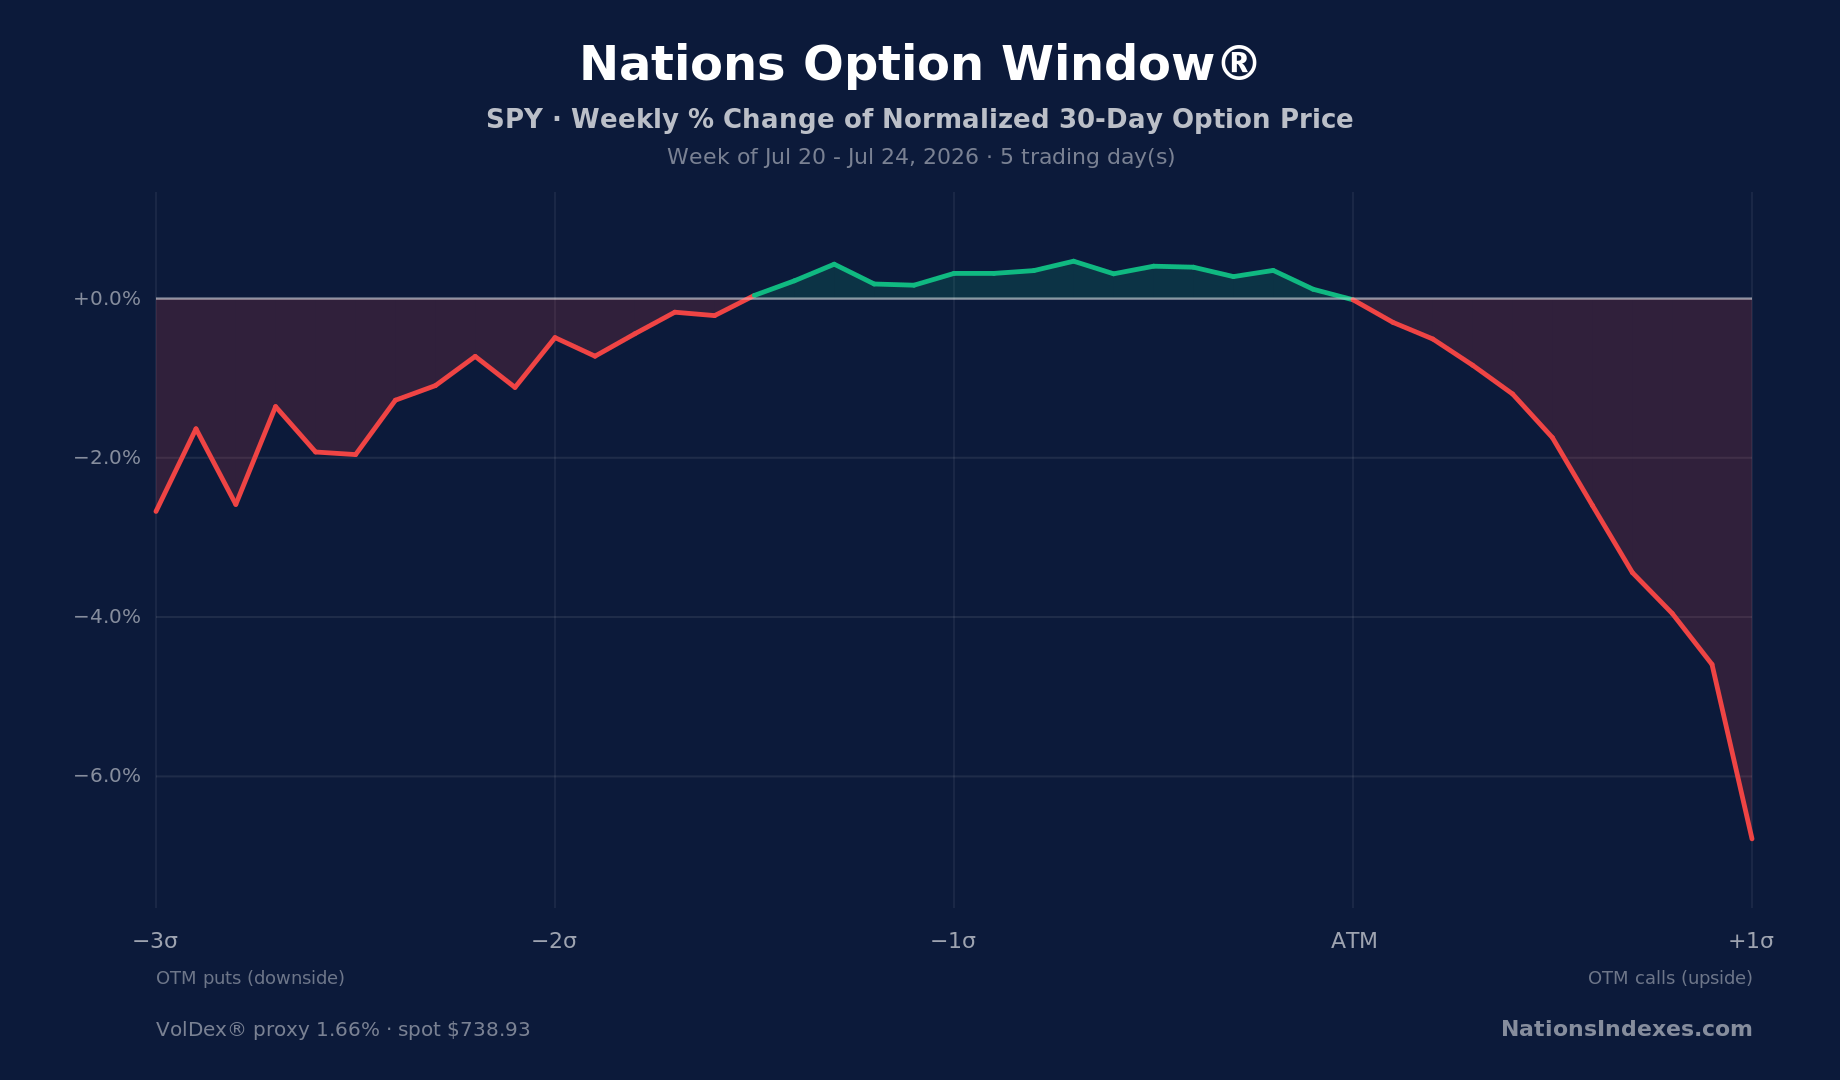
The Nations Option Window® shows how option flows were driving S&P 500 option prices at fixed locations on the skew. Since each point has a fixed delta and constant 30 day maturity, changes are a function of supply and demand rather than movement of the S&P 500 or the passage of time.
Traders were buying at-the-money options and just out-of-the-money puts in S&P options but were selling deep out-of-the-money options as they position for activity to fall during the typically slow period in August.
0DTE and 1DTE Options:
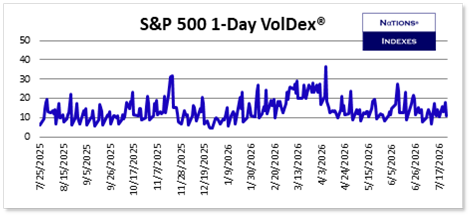
S&P 500 1-Day VolDex rose 1.17% this week as some traders continue to worry about weekend developments in the Middle East.
Very short-dated volatility measures which use a variance swap methodology, as 1-day VIX does, inject significant error into the resulting measure because of the way out-of-the-money options trade in the hours before expiration. The VolDex at-the-money methodology is particularly suited for these very short-dated tenors.
Other Asset Volatility:
Treasury Bonds and Notes:
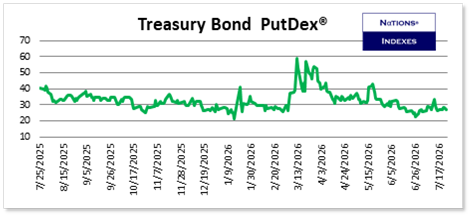
Bond and Note yields rose dramatically this week yet Treasury Bond PutDex fell slightly and closed at just the 15th percentile of its 52-week range. Long put structures in TLT options make sense for bond bears with Treasury Bond PutDex below 30.00 and become very compelling below 22.50.
Precious Metals:
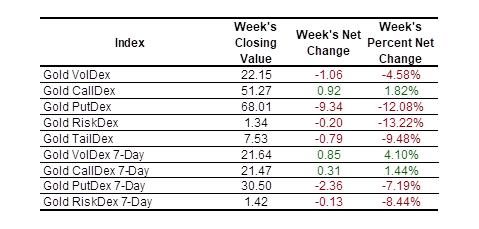
Gold rose 0.95% after falling 2.49% last week. Volatility in gold eased as the price decline reversed slightly. Higher interest rates are problematic for gold so we will continue to watch the precious metals for signals from the option market.
Equities:
VolDex was generally lower for the names we cover as you can see although we’ve added MU, XOM, INTC, ORCL and SPCX to our coverage universe and we’ll including them in future editions of Volatility Insights. Volatility fell as the worst fears of the previous week faded.
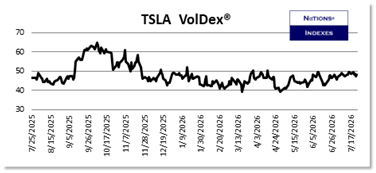
TSLA was the big loser, falling 17.81%, as second-quarter earnings of 33 cents fell well short of the 55 cent consensus. The carmaker posted negative free cash flow of $1.09 billion and investors threw in the towel on shares that were already very expensive on a PE basis.
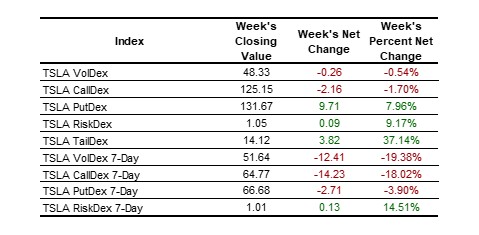
TSLA VolDex displayed a volatility crush albeit a very minor one with TSLA VolDex falling just 0.54% due to the size of the loss posted by the shares.
The frothiness in CallDex for several names including META and MSFT has eased as earnings approach. CallDex values in both names were making new 52-week highs earlier in the week but META CallDex closed at the 67th percentile of its 52-week range while MSFT CallDex closed at the 84th percentile. Traders who used this information to sell calls were rewarded.
We’ll continue to comment during the week via our X account, @Nations_Indexes
Scott’s Weekly Commentary:
It is remarkable that crude oil is up 34.45% since the start of the war with Iran and the stock market has managed to gain 7.75% during that period. Much is clearly due to exuberance about technology and AI and I agree AI will do wonderful things but I’m in the camp that believes the way to invest is to focus on stocks that will benefit from using AI rather than on AI names themselves. The productivity gains that can come from a $200 monthly subscription to Claude are staggering.
Bonds finally took note of the increase in the price of crude oil and the resurgent inflation it will drive. The 10-year yield briefly and barely topped 5% in October 2023 but you have to go back to the summer of 2007 to find the last time it was more than a few basis points about that level. If the capital needed for the AI buildout gets expensive then shares will suffer. That, and the upcoming earnings guidance, are the things I’m looking at.
I hope you have a safe and profitable week.
Scott